Estimated Value: $102,000 - $120,000
--
Bed
--
Bath
1,295
Sq Ft
$86/Sq Ft
Est. Value
About This Home
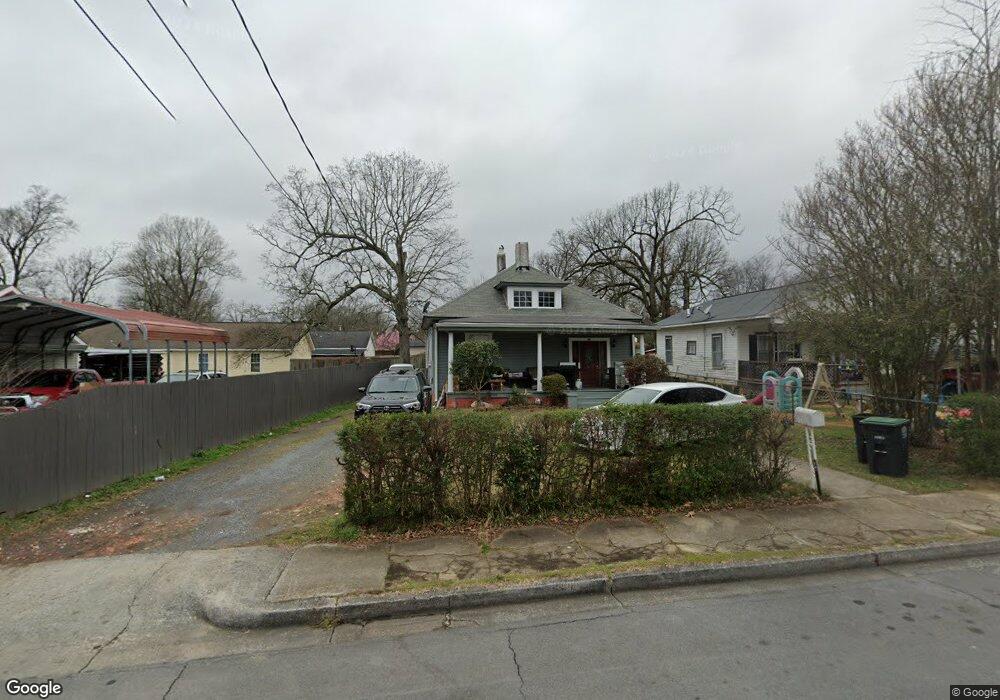
This home is located at 14 S Hughes St SW, Rome, GA 30165 and is currently estimated at $111,169, approximately $85 per square foot. 14 S Hughes St SW is a home located in Floyd County with nearby schools including Rome High School and St. Mary School.
Ownership History
Date
Name
Owned For
Owner Type
Purchase Details
Closed on
Nov 15, 2004
Sold by
Rayon Jose H
Bought by
Portuguez Agustin
Current Estimated Value
Purchase Details
Closed on
Mar 19, 2004
Sold by
Federal National Mortgage Association
Bought by
Rayon Jose H
Purchase Details
Closed on
Mar 17, 2004
Sold by
Union Planters Bank Na
Bought by
Federal National Mortgage Association
Purchase Details
Closed on
Jan 6, 2004
Sold by
Dahn Timothy
Bought by
Union Planters Bank Na
Purchase Details
Closed on
Aug 20, 2002
Sold by
Little Glenda Sue
Bought by
Dahn Timothy
Purchase Details
Closed on
May 9, 2000
Sold by
Bishop Mary Elizabeth
Bought by
Little Glenda Sue
Purchase Details
Closed on
Sep 14, 1999
Sold by
Mary Bishop W and Mary Elizabeth Bishop
Bought by
Bishop Mary Elizabeth
Purchase Details
Closed on
Oct 11, 1991
Sold by
Bishop W B
Bought by
Mary Bishop W and Mary Elizabeth Bishop
Purchase Details
Closed on
Jul 1, 1944
Bought by
Bishop W B
Create a Home Valuation Report for This Property
The Home Valuation Report is an in-depth analysis detailing your home's value as well as a comparison with similar homes in the area
Home Values in the Area
Average Home Value in this Area
Purchase History
| Date | Buyer | Sale Price | Title Company |
|---|---|---|---|
| Portuguez Agustin | $84,900 | -- | |
| Rayon Jose H | -- | -- | |
| Federal National Mortgage Association | -- | -- | |
| Union Planters Bank Na | $49,800 | -- | |
| Dahn Timothy | $57,500 | -- | |
| Little Glenda Sue | -- | -- | |
| Bishop Mary Elizabeth | -- | -- | |
| Mary Bishop W | -- | -- | |
| Bishop W B | -- | -- |
Source: Public Records
Tax History Compared to Growth
Tax History
| Year | Tax Paid | Tax Assessment Tax Assessment Total Assessment is a certain percentage of the fair market value that is determined by local assessors to be the total taxable value of land and additions on the property. | Land | Improvement |
|---|---|---|---|---|
| 2024 | $1,580 | $40,671 | $6,357 | $34,314 |
| 2023 | $1,440 | $38,525 | $5,650 | $32,875 |
| 2022 | $1,163 | $31,873 | $4,709 | $27,164 |
| 2021 | $1,076 | $28,993 | $4,709 | $24,284 |
| 2020 | $988 | $26,400 | $3,532 | $22,868 |
| 2019 | $923 | $24,937 | $3,532 | $21,405 |
| 2018 | $870 | $23,498 | $3,532 | $19,966 |
| 2017 | $839 | $22,648 | $3,532 | $19,116 |
| 2016 | $876 | $23,600 | $3,520 | $20,080 |
| 2015 | $828 | $23,600 | $3,520 | $20,080 |
| 2014 | $828 | $23,600 | $3,520 | $20,080 |
Source: Public Records
Map
Nearby Homes
- 8 S Hughes St SW
- 204 Cherry St SW
- 0 Mount Alto Rd SW Unit 10523740
- 3 Berckman Ln SW
- 14 Berckman Ln SW
- 21 Sweetspire Dr NW
- 23 Sweetspire Dr NW
- 15 Silverbell Ln
- 13 Ridgewood Rd SW
- 8 Leon St SW
- 50 Melton Ave SW
- 19 Berckman Ln SW
- 214 N Elm St NW
- 55 Ridgewood Rd SW
- 209 Sherwood Rd SW
- 40 Paris Dr SW
- 100 Dellwood Dr NW
- 311 Wilkerson Rd SW
- 313 Wilkerson Rd SW
- 9 Shorter Cir SW
- 12 S Hughes St SW
- 798 Ethel Ave SW
- 800 Ethel Ave SW
- 18 S Hughes St SW
- 802 Ethel Ave SW
- 100 S Hughes St SW
- 13 Cherry St SW
- 3 S Hughes St SW
- 7 S Hughes St SW
- 11 Cherry St SW
- 11 S Hughes St SW
- 5 S Hughes St SW
- 9 S Hughes St SW
- 102 S Hughes St SW
- 15 Cherry St SW
- 101 Cherry St SW
- 9 Cherry St SW
- 17 Cherry St SW
- 3 S Hughes St SW
- 13 S Hughes St SW