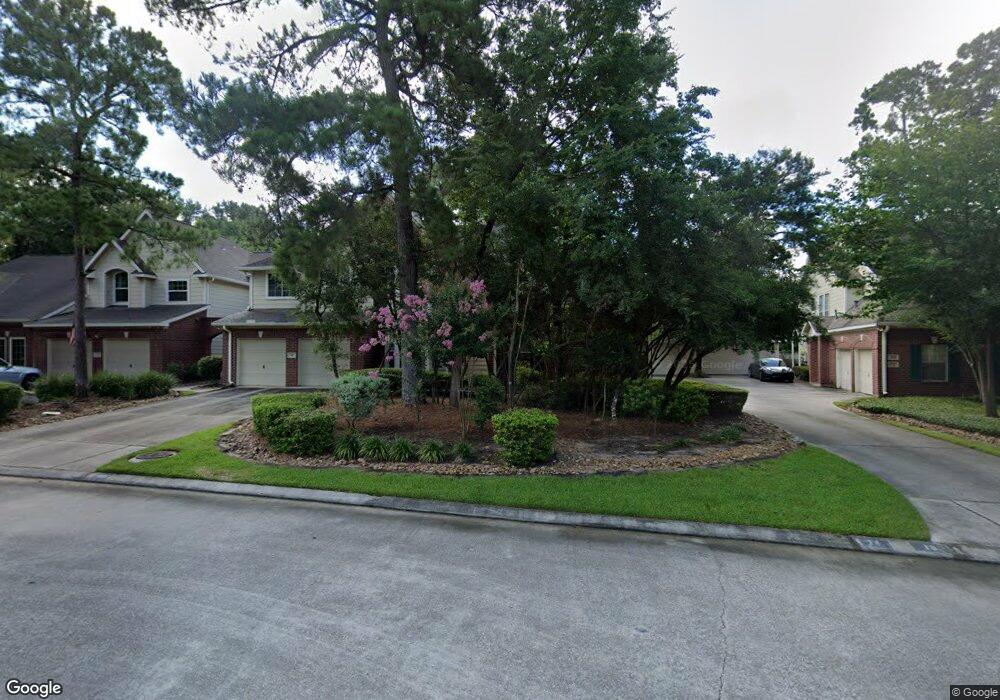
14 S Magnolia Pond Place Unit 14 Spring, TX 77381
Panther Creek NeighborhoodEstimated Value: $251,974 - $303,000
2
Beds
2
Baths
1,233
Sq Ft
$221/Sq Ft
Est. Value
About This Home
This home is located at 14 S Magnolia Pond Place Unit 14, Spring, TX 77381 and is currently estimated at $272,994, approximately $221 per square foot. 14 S Magnolia Pond Place Unit 14 is a home located in Montgomery County with nearby schools including Ride Elementary School, Collins Intermediate School, and Knox J High School.
Ownership History
Date
Name
Owned For
Owner Type
Purchase Details
Closed on
Jul 23, 2014
Sold by
Trate Rachel and Ray Alexander
Bought by
Trate Richard L
Current Estimated Value
Purchase Details
Closed on
Jul 1, 2005
Sold by
Lenkerd Melissa G
Bought by
Trate Richard L
Purchase Details
Closed on
Jan 5, 2000
Sold by
Worrel Edward J and Smith Lindy R
Bought by
Lenkerd Melissa G
Home Financials for this Owner
Home Financials are based on the most recent Mortgage that was taken out on this home.
Original Mortgage
$90,733
Interest Rate
7.5%
Purchase Details
Closed on
Jun 1, 1995
Sold by
Ryland Group Inc
Bought by
Worrell Edward J and Smith Lindy R
Home Financials for this Owner
Home Financials are based on the most recent Mortgage that was taken out on this home.
Original Mortgage
$65,900
Interest Rate
8.2%
Create a Home Valuation Report for This Property
The Home Valuation Report is an in-depth analysis detailing your home's value as well as a comparison with similar homes in the area
Home Values in the Area
Average Home Value in this Area
Purchase History
| Date | Buyer | Sale Price | Title Company |
|---|---|---|---|
| Trate Richard L | -- | None Available | |
| Trate Richard L | -- | -- | |
| Lenkerd Melissa G | -- | Stewart Title | |
| Worrell Edward J | -- | -- |
Source: Public Records
Mortgage History
| Date | Status | Borrower | Loan Amount |
|---|---|---|---|
| Previous Owner | Lenkerd Melissa G | $90,733 | |
| Previous Owner | Worrell Edward J | $65,900 |
Source: Public Records
Tax History Compared to Growth
Tax History
| Year | Tax Paid | Tax Assessment Tax Assessment Total Assessment is a certain percentage of the fair market value that is determined by local assessors to be the total taxable value of land and additions on the property. | Land | Improvement |
|---|---|---|---|---|
| 2025 | $4,168 | $233,671 | $16,910 | $216,761 |
| 2024 | $4,184 | $241,732 | $16,910 | $224,822 |
| 2023 | $4,184 | $241,840 | $16,910 | $224,930 |
| 2022 | $3,608 | $189,700 | $16,910 | $172,790 |
| 2021 | $3,434 | $167,500 | $16,910 | $150,590 |
| 2020 | $3,636 | $169,630 | $16,910 | $152,720 |
| 2019 | $4,003 | $180,600 | $16,910 | $163,690 |
| 2018 | $4,003 | $180,600 | $16,910 | $163,690 |
| 2017 | $3,611 | $159,690 | $16,910 | $142,780 |
| 2016 | $3,348 | $154,230 | $16,910 | $137,320 |
| 2015 | $2,973 | $174,020 | $16,910 | $157,110 |
| 2014 | $2,973 | $136,830 | $16,910 | $119,920 |
Source: Public Records
Map
Nearby Homes
- 135 N Magnolia Pond Place
- 150 N Magnolia Pond Place
- 138 N Magnolia Pond Place
- 94 S Magnolia Pond Place
- 19 Tremont Woods Ct
- 6 Fairmeade Bend Dr
- 15 Brentwood Oaks Ct
- 115 Fallshire Dr
- 19 Hickory Oak Dr
- 50 Lakeridge Dr
- 38 Cricket Hollow Place
- 15 Lakeridge Dr
- 4 Hickory Oak Dr
- 31 Treescape Cir
- 6 Sylvan Forest Dr
- 7 Dusky Meadow Place
- 52 Indian Clover Dr
- 23 Indian Clover Dr
- 24 Woodelves Place
- 35 Indian Clover Dr
- 14 S Magnolia Pond Place
- 18 S Magnolia Pond Place
- 18 S Magnolia Pond Place Unit 18B
- 10 S Magnolia Pond Place
- 10 S Magnolia Pond Place Unit 10E
- 6 S Magnolia Pond Place
- 22 S Magnolia Pond Place
- 22 S Magnolia Pond Place Unit 22A
- 2 S Magnolia Pond Place
- 26 S Magnolia Pond Place
- 26 S Magnolia Pond Place Unit 26B
- 30 S Magnolia Pond Place
- 34 S Magnolia Pond Place
- 38 S Magnolia Pond Place
- 143 N Magnolia Pond Place
- 170 N Magnolia Pond Place
- 170 N Magnolia Pond Place Unit 170D
- 139 N Magnolia Pond Place
- 166 N Magnolia Pond Place
- 162 N Magnolia Pond Place