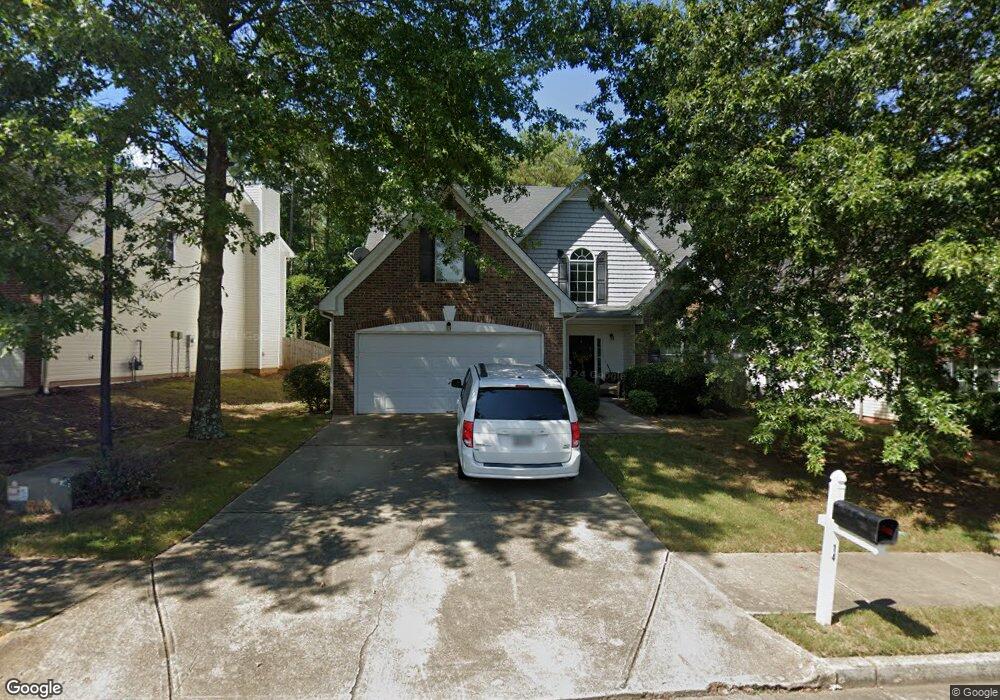
14 Saint Charles Place Unit 4 Sharpsburg, GA 30277
Estimated Value: $344,186 - $377,000
4
Beds
3
Baths
2,078
Sq Ft
$176/Sq Ft
Est. Value
About This Home
This home is located at 14 Saint Charles Place Unit 4, Sharpsburg, GA 30277 and is currently estimated at $364,797, approximately $175 per square foot. 14 Saint Charles Place Unit 4 is a home located in Coweta County with nearby schools including Poplar Road Elementary School, Lee Middle School, and East Coweta High School.
Ownership History
Date
Name
Owned For
Owner Type
Purchase Details
Closed on
Jun 25, 2015
Sold by
Ih2 Property Georgia Lp
Bought by
2015 3 Ih2 Borrower Lp
Current Estimated Value
Purchase Details
Closed on
Jun 10, 2013
Sold by
Chan Mark Jamison
Bought by
Ih2 Property Georgia Lp
Purchase Details
Closed on
Dec 22, 2006
Sold by
Scenic Homes
Bought by
Chan Mark J and Chan Charity N
Home Financials for this Owner
Home Financials are based on the most recent Mortgage that was taken out on this home.
Original Mortgage
$133,550
Interest Rate
6.19%
Mortgage Type
New Conventional
Purchase Details
Closed on
Jun 9, 2005
Sold by
Olde Towne Builders Inc
Bought by
Bellwood Homes Llc
Purchase Details
Closed on
Jan 12, 2005
Sold by
Parks Road Investment Llc
Bought by
Olde Towne Builders Inc
Purchase Details
Closed on
Apr 21, 2003
Sold by
Parks Joseph W
Bought by
Parks Road Investment Llc
Create a Home Valuation Report for This Property
The Home Valuation Report is an in-depth analysis detailing your home's value as well as a comparison with similar homes in the area
Home Values in the Area
Average Home Value in this Area
Purchase History
| Date | Buyer | Sale Price | Title Company |
|---|---|---|---|
| 2015 3 Ih2 Borrower Lp | -- | -- | |
| Ih2 Property Georgia Lp | $140,000 | -- | |
| Chan Mark J | $167,000 | -- | |
| Bellwood Homes Llc Dba Scenic Homes | -- | -- | |
| Bellwood Homes Llc | $1,218,000 | -- | |
| Olde Towne Builders Inc | $1,106,000 | -- | |
| Parks Road Investment Llc | $4,316,400 | -- |
Source: Public Records
Mortgage History
| Date | Status | Borrower | Loan Amount |
|---|---|---|---|
| Previous Owner | Bellwood Homes Llc Dba Scenic Homes | $133,550 |
Source: Public Records
Tax History Compared to Growth
Tax History
| Year | Tax Paid | Tax Assessment Tax Assessment Total Assessment is a certain percentage of the fair market value that is determined by local assessors to be the total taxable value of land and additions on the property. | Land | Improvement |
|---|---|---|---|---|
| 2025 | $3,124 | $130,048 | $14,268 | $115,780 |
| 2024 | $2,972 | $130,048 | $30,000 | $100,048 |
| 2023 | $2,972 | $120,771 | $22,000 | $98,771 |
| 2022 | $2,446 | $100,526 | $22,000 | $78,526 |
| 2021 | $2,317 | $86,204 | $16,000 | $70,204 |
| 2020 | $2,108 | $90,216 | $16,000 | $74,216 |
| 2019 | $2,163 | $72,003 | $12,000 | $60,003 |
| 2018 | $2,176 | $72,003 | $12,000 | $60,003 |
| 2017 | $2,167 | $72,003 | $12,000 | $60,003 |
| 2016 | $2,100 | $69,759 | $12,000 | $57,759 |
| 2015 | $1,898 | $62,933 | $12,000 | $50,933 |
| 2014 | $1,507 | $54,632 | $10,000 | $44,632 |
Source: Public Records
Map
Nearby Homes
- 25 Pacific Ave
- 0 Poplar Rd Unit 10580891
- 162 Ashton Place
- 9 Marvin Gardens
- 24 Marvin Gardens
- 105 Turnberry Trace
- 108 Turnberry Trace
- 161 Briandwood Dr
- 53 Fox Ridge Dr
- 37 Fox Ridge Dr
- 28 Fox Ridge Dr
- 2752 Poplar Rd
- 0 Mary Freeman Rd Unit 20069973
- Camden Plan at Candleberry Place
- Savannah Plan at Candleberry Place
- Briarwood Plan at Candleberry Place
- Newport Plan at Candleberry Place
- 5 Candleberry Way
- 14 Avondale Cir
- 10 Fenway Ct
- 14 Saint Charles Place
- 14 Saint Charles Place Unit 14
- 10 Saint Charles Place Unit 3
- 10 Saint Charles Place
- 10 Saint Charles Place Unit 580
- 18 Saint Charles Place
- 10 St Charles Place
- 6 Saint Charles Place
- 6 Saint Charles Place Unit 582
- 22 Saint Charles Place
- 6 St Charles Place
- 2 Saint Charles Place
- 11 Saint Charles Place
- 11 Saint Charles Place Unit 382
- 11 Saint Charles Place Unit 579
- 7 Saint Charles Place
- 7 Saint Charles Place Unit 577
- 3 Saint Charles Place
- 3 Saint Charles Place Unit 575
- 25 Saint Charles Place