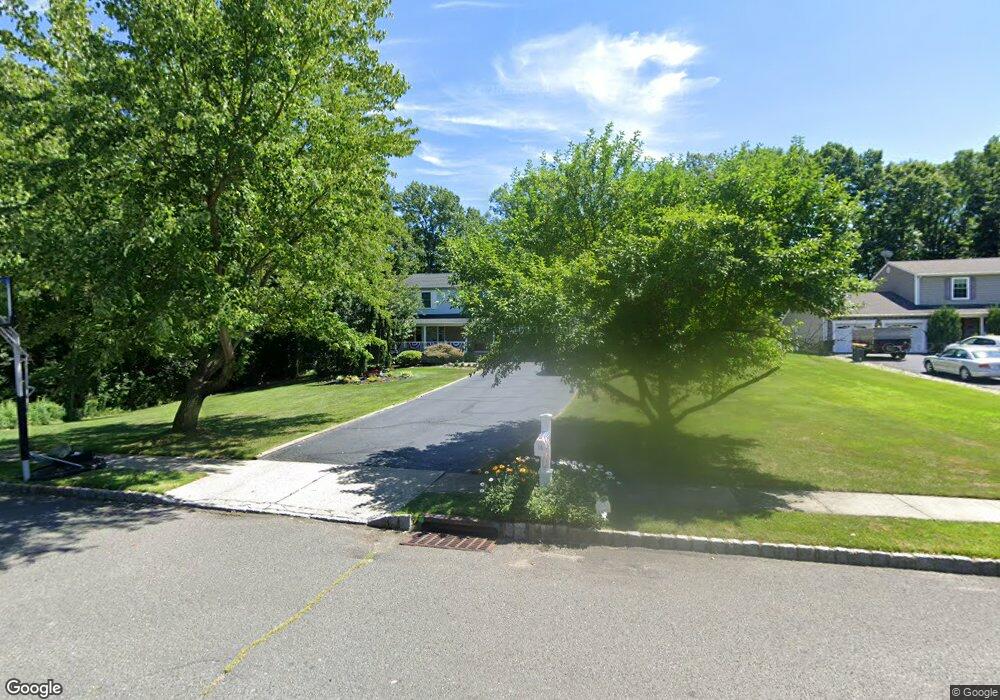
14 Scott Dr Hazlet, NJ 07730
Estimated Value: $673,000
4
Beds
3
Baths
1,950
Sq Ft
$345/Sq Ft
Est. Value
About This Home
This home is located at 14 Scott Dr, Hazlet, NJ 07730 and is currently estimated at $673,000, approximately $345 per square foot. 14 Scott Dr is a home located in Monmouth County with nearby schools including Raritan High School, Baytul-Iman Academy, and St. Ann School.
Ownership History
Date
Name
Owned For
Owner Type
Purchase Details
Closed on
Aug 19, 2005
Sold by
Gullo John
Current Estimated Value
Home Financials for this Owner
Home Financials are based on the most recent Mortgage that was taken out on this home.
Original Mortgage
$359,500
Outstanding Balance
$190,425
Interest Rate
5.79%
Mortgage Type
New Conventional
Estimated Equity
$482,575
Purchase Details
Closed on
Jan 16, 1996
Sold by
Romano Peter
Bought by
Gullo John and Gullo Lois
Home Financials for this Owner
Home Financials are based on the most recent Mortgage that was taken out on this home.
Original Mortgage
$158,000
Interest Rate
7.25%
Create a Home Valuation Report for This Property
The Home Valuation Report is an in-depth analysis detailing your home's value as well as a comparison with similar homes in the area
Home Values in the Area
Average Home Value in this Area
Purchase History
| Date | Buyer | Sale Price | Title Company |
|---|---|---|---|
| -- | $450,000 | -- | |
| Gullo John | $164,000 | -- |
Source: Public Records
Mortgage History
| Date | Status | Borrower | Loan Amount |
|---|---|---|---|
| Open | -- | $359,500 | |
| Previous Owner | Gullo John | $158,000 |
Source: Public Records
Tax History Compared to Growth
Tax History
| Year | Tax Paid | Tax Assessment Tax Assessment Total Assessment is a certain percentage of the fair market value that is determined by local assessors to be the total taxable value of land and additions on the property. | Land | Improvement |
|---|---|---|---|---|
| 2025 | $11,497 | $584,000 | $317,400 | $266,600 |
| 2024 | $11,709 | $546,700 | $281,300 | $265,400 |
| 2023 | $11,709 | $547,900 | $263,300 | $284,600 |
| 2022 | $11,276 | $479,700 | $229,100 | $250,600 |
| 2021 | $11,276 | $439,600 | $216,700 | $222,900 |
| 2020 | $10,979 | $425,200 | $212,900 | $212,300 |
| 2019 | $10,799 | $411,700 | $200,600 | $211,100 |
| 2018 | $10,503 | $397,100 | $195,800 | $201,300 |
| 2017 | $10,226 | $386,600 | $190,600 | $196,000 |
| 2016 | $10,058 | $381,700 | $190,600 | $191,100 |
| 2015 | $9,902 | $376,800 | $190,600 | $186,200 |
| 2014 | $9,874 | $352,400 | $174,900 | $177,500 |
Source: Public Records
Map
Nearby Homes