14 Sequoia Dr Tyngsboro, MA 01879
Estimated Value: $746,000 - $916,000
About This Home
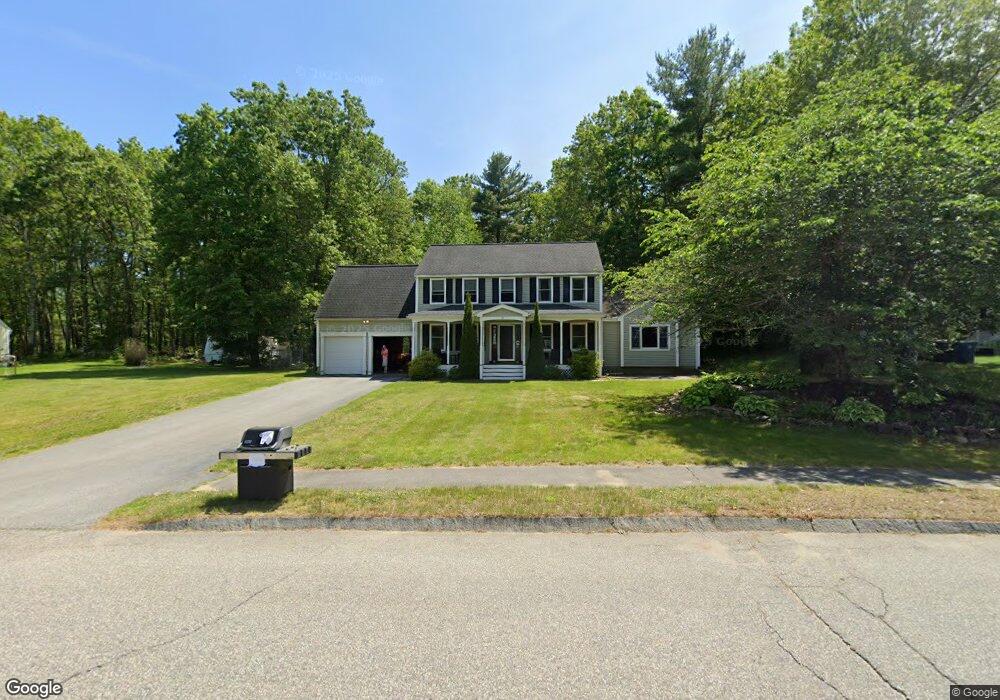
This home is located at 14 Sequoia Dr, Tyngsboro, MA 01879 and is currently estimated at $822,387, approximately $336 per square foot. 14 Sequoia Dr is a home located in Middlesex County with nearby schools including Tyngsborough Elementary School, Tyngsborough Middle School, and Tyngsborough High School.
Ownership History
We collect this data history from publicly available records. To have your information removed, we recommend requesting removal directly through your county’s website.
Purchase Details
Home Financials for this Owner
Home Financials are based on the most recent Mortgage that was taken out on this home.Purchase Details
Purchase Details
Home Values in the Area
Average Home Value in this Area
Purchase History
We collect this data history from publicly available records. To have your information removed, we recommend requesting removal directly through your county’s website.
| Date | Buyer | Sale Price | Title Company |
|---|---|---|---|
| $475,000 | -- | ||
| $161,950 | -- | ||
| $90,000 | -- |
Mortgage History
We collect this data history from publicly available records. To have your information removed, we recommend requesting removal directly through your county’s website.
| Date | Status | Borrower | Loan Amount |
|---|---|---|---|
| Open | $380,000 | ||
| Closed | $380,000 | ||
| Previous Owner | $215,000 |
Tax History
We collect this data history from publicly available records. To have your information removed, we recommend requesting removal directly through your county’s website.
| Year | Tax Paid | Tax Assessment Tax Assessment Total Assessment is a certain percentage of the fair market value that is determined by local assessors to be the total taxable value of land and additions on the property. | Land | Improvement |
|---|---|---|---|---|
| 2025 | $83 | $670,000 | $265,700 | $404,300 |
| 2024 | $8,302 | $652,700 | $259,200 | $393,500 |
| 2023 | $7,872 | $556,700 | $215,600 | $341,100 |
| 2022 | $7,548 | $505,200 | $187,300 | $317,900 |
| 2021 | $7,389 | $459,800 | $169,900 | $289,900 |
| 2020 | $7,288 | $448,500 | $161,200 | $287,300 |
| 2019 | $7,004 | $413,700 | $152,500 | $261,200 |
| 2018 | $6,808 | $397,900 | $152,500 | $245,400 |
| 2017 | $6,588 | $383,900 | $152,500 | $231,400 |
| 2016 | $6,448 | $367,200 | $152,500 | $214,700 |
| 2015 | $6,153 | $362,800 | $148,100 | $214,700 |
Map
- 36 Willowdale Rd Unit B
- 24 Bowers Ave
- 4 Bowers Ave
- 47 Sequoia Dr
- 9 Robinhood Rd
- 41 Derby Ln Unit 41
- 195 Lakeview Ave
- 203 Lakeview Ave
- 1 Juniper Ln Unit 1
- 11 Lawndale Rd
- 5 Bridgeview Cir Unit 12
- 3 Bridgeview Cir Unit 53
- 59 Juniper Ln Unit 59
- 49 Riley Rd Unit 25
- 27 Riley Rd Unit 27
- 27 Dexter Ave
- 3 Birchmont St
- 22 Merrimac Way Unit B
- 87 Riley Rd Unit 87
- 91 Riley Rd Unit 91
Ask me questions while you tour the home.