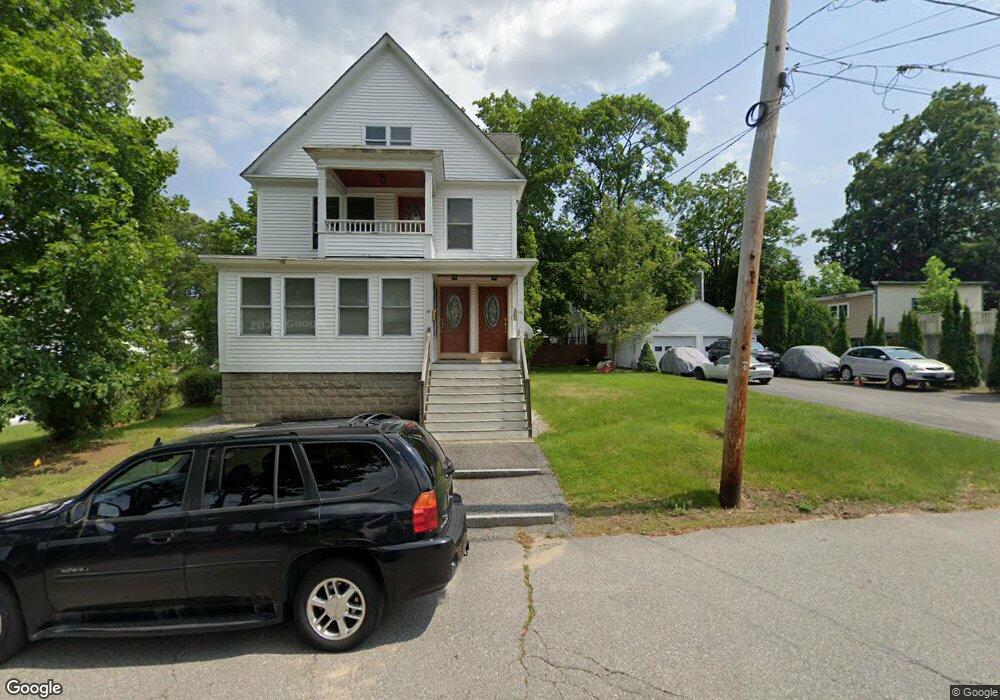
14 Shaw St Unit 16 North Chelmsford, MA 01863
North Chelmsford NeighborhoodEstimated Value: $658,359 - $838,000
4
Beds
2
Baths
2,266
Sq Ft
$328/Sq Ft
Est. Value
About This Home
This home is located at 14 Shaw St Unit 16, North Chelmsford, MA 01863 and is currently estimated at $744,340, approximately $328 per square foot. 14 Shaw St Unit 16 is a home located in Middlesex County with nearby schools including Parker Middle School, Collegiate Charter School of Lowell, and Keystone Montessori School.
Ownership History
Date
Name
Owned For
Owner Type
Purchase Details
Closed on
Apr 24, 2009
Sold by
Bevis Karen A
Bought by
Deo Ly Kim and Ko Yuk Kong
Current Estimated Value
Home Financials for this Owner
Home Financials are based on the most recent Mortgage that was taken out on this home.
Original Mortgage
$285,000
Outstanding Balance
$179,291
Interest Rate
4.93%
Mortgage Type
Purchase Money Mortgage
Estimated Equity
$565,049
Purchase Details
Closed on
Jul 15, 2008
Sold by
Gauthier Eileen Est and Gauthier
Bought by
Gauthier Arthur J
Purchase Details
Closed on
Jun 10, 2005
Sold by
Gauthier Eileen Est and Gauthier
Bought by
Mulder Timothy
Home Financials for this Owner
Home Financials are based on the most recent Mortgage that was taken out on this home.
Original Mortgage
$200,000
Interest Rate
5.79%
Mortgage Type
Purchase Money Mortgage
Create a Home Valuation Report for This Property
The Home Valuation Report is an in-depth analysis detailing your home's value as well as a comparison with similar homes in the area
Home Values in the Area
Average Home Value in this Area
Purchase History
| Date | Buyer | Sale Price | Title Company |
|---|---|---|---|
| Deo Ly Kim | $380,000 | -- | |
| Deo Ly Kim | $380,000 | -- | |
| Deo Ly Kim | $380,000 | -- | |
| Gauthier Arthur J | $206,000 | -- | |
| Bevis Karen | $146,000 | -- | |
| Gauthier Arthur J | $206,000 | -- | |
| Mulder Timothy | $250,000 | -- | |
| Mulder Timothy | $250,000 | -- |
Source: Public Records
Mortgage History
| Date | Status | Borrower | Loan Amount |
|---|---|---|---|
| Open | Deo Ly Kim | $285,000 | |
| Closed | Mulder Timothy | $285,000 | |
| Previous Owner | Mulder Timothy | $200,000 |
Source: Public Records
Tax History Compared to Growth
Tax History
| Year | Tax Paid | Tax Assessment Tax Assessment Total Assessment is a certain percentage of the fair market value that is determined by local assessors to be the total taxable value of land and additions on the property. | Land | Improvement |
|---|---|---|---|---|
| 2025 | $7,819 | $562,500 | $255,800 | $306,700 |
| 2024 | $7,661 | $562,500 | $255,800 | $306,700 |
| 2023 | $7,126 | $495,900 | $275,000 | $220,900 |
| 2022 | $7,074 | $448,600 | $239,100 | $209,500 |
| 2021 | $6,545 | $415,800 | $221,600 | $194,200 |
| 2020 | $5,991 | $364,200 | $200,600 | $163,600 |
| 2019 | $5,922 | $362,200 | $198,600 | $163,600 |
| 2018 | $6,151 | $342,500 | $178,900 | $163,600 |
| 2017 | $5,808 | $324,100 | $167,500 | $156,600 |
| 2016 | $5,919 | $328,300 | $158,200 | $170,100 |
| 2015 | $6,190 | $331,000 | $134,800 | $196,200 |
| 2014 | $6,269 | $330,300 | $134,100 | $196,200 |
Source: Public Records
Map
Nearby Homes
- 10 Mansur St
- 29 Middlesex St Unit 1
- 16 Middlesex St Unit 4
- 71 Princeton St Unit 303
- 33 Kennedy Dr Unit 33
- 94 Princeton St Unit 1
- 96 Princeton St Unit 2
- 30 Russell Rd
- 10 Butterfield St
- 436 Wellman Ave
- 330 Wellman Ave
- 271 Wellman Ave
- 251 Wellman Ave Unit 251
- 739 Wellman Ave
- 730 Wellman Ave
- 126 Groton Rd
- 415 Wellman Ave
- 863 Wellman Ave Unit 863
- 14 Muirfield Way
- 1401 Pawtucket Blvd Unit 10
- 25 Wright St Unit 27
- 44 Newfield St
- 44 Newfield St
- 15 Shaw St
- 40 Newfield St
- 35 Wright St Unit 37
- 35-37 Wright St Unit 2
- 35-37 Wright St Unit 1
- 28 Wright St Unit B
- 36 Newfield St
- 36 Wright St
- 16 Wright St Unit 20
- 23 Washington St
- 9 Princeton St
- 99999 Tanning Salon
- 1 Mansur St
- 18 Adams St
- 15 Washington St Unit 17
- 12 Wright St Unit 12 Wright
- 20 Adams St