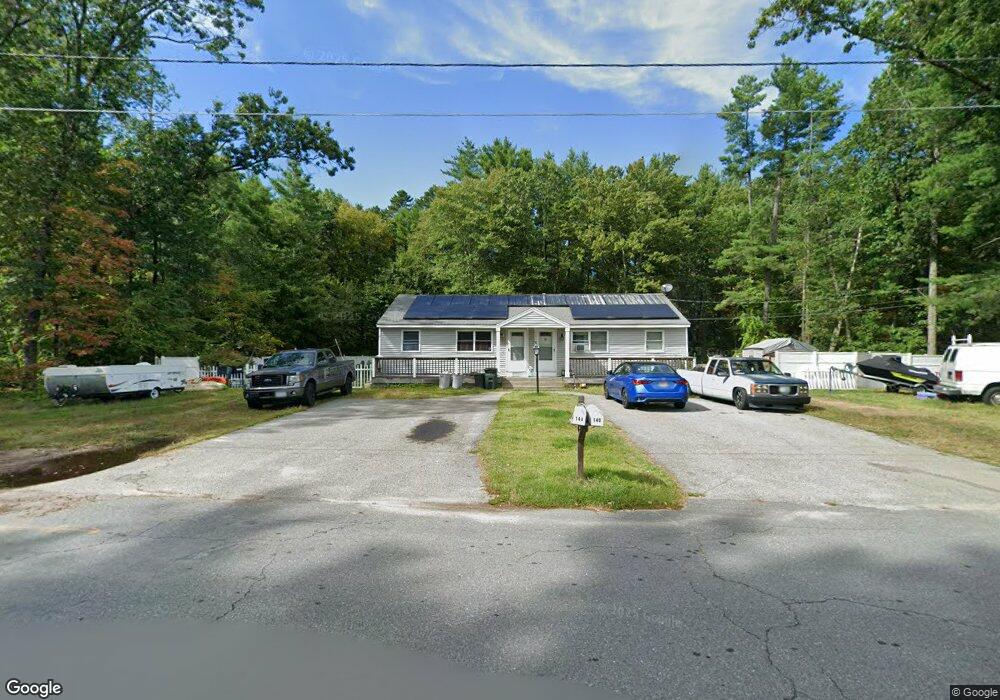
14 Shawnee Rd Unit 2 Pepperell, MA 01463
Estimated Value: $535,370 - $681,000
2
Beds
1
Bath
720
Sq Ft
$812/Sq Ft
Est. Value
About This Home
This home is located at 14 Shawnee Rd Unit 2, Pepperell, MA 01463 and is currently estimated at $584,593, approximately $811 per square foot. 14 Shawnee Rd Unit 2 is a home located in Middlesex County with nearby schools including North Middlesex Regional High School, Pepperell Christian Academy, and Maple Dene & Moppet School.
Ownership History
Date
Name
Owned For
Owner Type
Purchase Details
Closed on
Dec 21, 2020
Sold by
Granberg Amanda L
Bought by
Granberg Paul A
Current Estimated Value
Home Financials for this Owner
Home Financials are based on the most recent Mortgage that was taken out on this home.
Original Mortgage
$237,000
Outstanding Balance
$209,048
Interest Rate
2.7%
Mortgage Type
New Conventional
Estimated Equity
$375,545
Purchase Details
Closed on
Jun 13, 2013
Sold by
Murphy George A and Murphy Rachel C
Bought by
Granberg Paul A and Granberg Amanda L
Home Financials for this Owner
Home Financials are based on the most recent Mortgage that was taken out on this home.
Original Mortgage
$255,290
Interest Rate
3.39%
Mortgage Type
FHA
Purchase Details
Closed on
Sep 24, 1992
Sold by
Federal Home Loan Mortgage Corporation
Bought by
Murphy George A and Murphy Rachel C
Home Financials for this Owner
Home Financials are based on the most recent Mortgage that was taken out on this home.
Original Mortgage
$76,323
Interest Rate
7.9%
Mortgage Type
Purchase Money Mortgage
Create a Home Valuation Report for This Property
The Home Valuation Report is an in-depth analysis detailing your home's value as well as a comparison with similar homes in the area
Home Values in the Area
Average Home Value in this Area
Purchase History
| Date | Buyer | Sale Price | Title Company |
|---|---|---|---|
| Granberg Paul A | -- | None Available | |
| Granberg Paul A | $260,000 | -- | |
| Granberg Paul A | $260,000 | -- | |
| Granberg Paul A | $260,000 | -- | |
| Murphy George A | $80,340 | -- |
Source: Public Records
Mortgage History
| Date | Status | Borrower | Loan Amount |
|---|---|---|---|
| Open | Granberg Paul A | $237,000 | |
| Previous Owner | Granberg Paul A | $255,290 | |
| Previous Owner | Murphy George A | $76,323 | |
| Previous Owner | Murphy George A | $27,552 |
Source: Public Records
Tax History
| Year | Tax Paid | Tax Assessment Tax Assessment Total Assessment is a certain percentage of the fair market value that is determined by local assessors to be the total taxable value of land and additions on the property. | Land | Improvement |
|---|---|---|---|---|
| 2025 | $6,377 | $435,900 | $142,700 | $293,200 |
| 2024 | $5,927 | $413,000 | $130,300 | $282,700 |
| 2023 | $5,676 | $374,900 | $117,900 | $257,000 |
| 2022 | $5,591 | $326,000 | $105,500 | $220,500 |
| 2021 | $5,346 | $298,300 | $93,000 | $205,300 |
| 2020 | $4,790 | $282,100 | $93,000 | $189,100 |
| 2019 | $4,504 | $271,500 | $93,000 | $178,500 |
| 2018 | $4,450 | $271,500 | $93,000 | $178,500 |
| 2017 | $4,303 | $270,800 | $93,000 | $177,800 |
| 2016 | $4,109 | $248,600 | $93,000 | $155,600 |
| 2015 | $3,965 | $248,600 | $93,000 | $155,600 |
| 2014 | $3,825 | $241,200 | $86,800 | $154,400 |
Source: Public Records
Map
Nearby Homes
- 38 Tarbell St Unit 5B
- 38 Tarbell St Unit 1D
- 29 Tarbell St
- 28-30 Groton St
- 8 Casie Ln
- 10 Bennett St
- 114 Groton St
- 39 Hollis St Unit A
- 208 North St
- 14 Brookline St
- 38 River Rd Unit 11
- 11 Unkety Brook Way
- 12 Unkety Brook Way
- 179 Wyman Rd
- 147 Nashua Rd
- 235 Kemp St
- 13 Birch Dr
- 53 Mclains Woods Rd
- 1 Nashua Rd
- 77 Birchwood Dr
- 14 Shawnee Rd
- 16 Shawnee Rd
- 16 Shawnee Rd Unit B
- 16 Shawnee Rd Unit A
- 13 Shawnee Rd
- 13 Shawnee Rd Unit 7
- 13 Shawnee Rd Unit 1
- 13 Shawnee Rd
- 13 Shawnee Rd Unit 13
- 13 Shawnee Rd Unit 12
- 23 Shawnee Rd Unit 4
- 21 Shawnee Rd Unit 1
- 23 Shawnee Rd Unit 2A
- 21 Shawnee Rd Unit 21
- 10 Shawnee Rd
- 10 Shawnee Rd Unit 2
- 10 Shawnee Rd Unit 1
- 18 Shawnee Rd
- 9 Shawnee Rd
- 8 Shawnee Rd
Your Personal Tour Guide
Ask me questions while you tour the home.