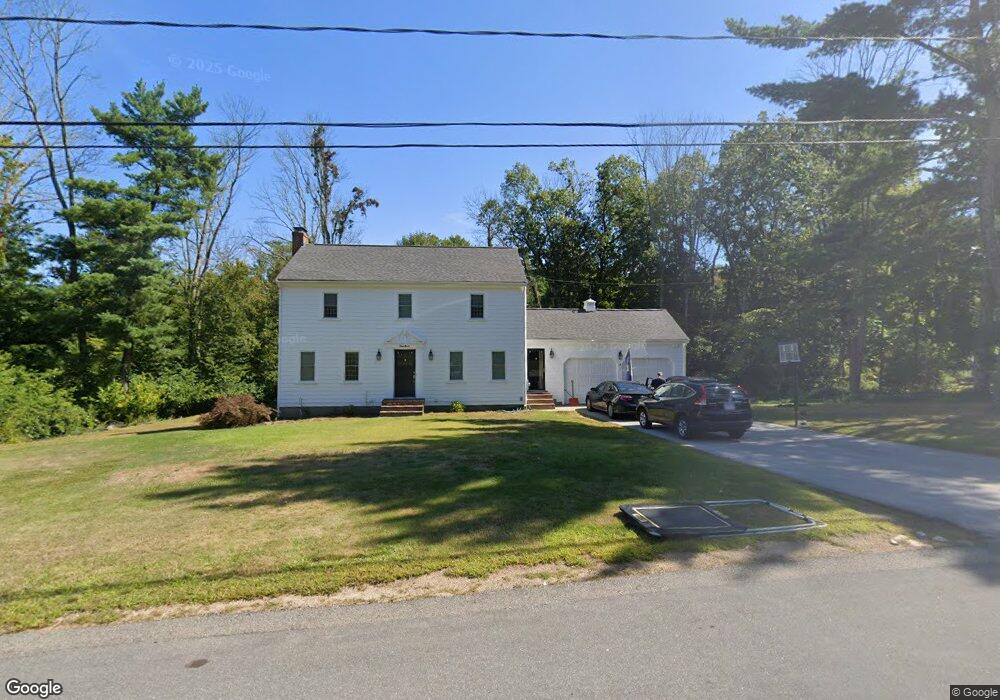
14 Simon Hill Rd Norwell, MA 02061
Estimated Value: $813,000 - $942,374
3
Beds
2
Baths
1,954
Sq Ft
$453/Sq Ft
Est. Value
About This Home
This home is located at 14 Simon Hill Rd, Norwell, MA 02061 and is currently estimated at $885,594, approximately $453 per square foot. 14 Simon Hill Rd is a home located in Plymouth County with nearby schools including Grace Farrar Cole Elementary School, Norwell Middle School, and Norwell High School.
Ownership History
Date
Name
Owned For
Owner Type
Purchase Details
Closed on
Feb 4, 2009
Sold by
Koch Brian T and Koch Katherine V
Bought by
Koch Brian F and Koch Katherine
Current Estimated Value
Home Financials for this Owner
Home Financials are based on the most recent Mortgage that was taken out on this home.
Original Mortgage
$376,500
Outstanding Balance
$239,264
Interest Rate
5.2%
Estimated Equity
$646,330
Purchase Details
Closed on
Nov 21, 2005
Sold by
Flynn Joseph F and Flynn Mary A
Bought by
Koch Brian T and Koch Katherine
Create a Home Valuation Report for This Property
The Home Valuation Report is an in-depth analysis detailing your home's value as well as a comparison with similar homes in the area
Home Values in the Area
Average Home Value in this Area
Purchase History
| Date | Buyer | Sale Price | Title Company |
|---|---|---|---|
| Koch Brian F | -- | -- | |
| Koch Brian F | -- | -- | |
| Koch Brian T | $509,000 | -- | |
| Koch Brian T | $509,000 | -- |
Source: Public Records
Mortgage History
| Date | Status | Borrower | Loan Amount |
|---|---|---|---|
| Open | Koch Brian T | $376,500 | |
| Previous Owner | Koch Brian T | $65,000 |
Source: Public Records
Tax History Compared to Growth
Tax History
| Year | Tax Paid | Tax Assessment Tax Assessment Total Assessment is a certain percentage of the fair market value that is determined by local assessors to be the total taxable value of land and additions on the property. | Land | Improvement |
|---|---|---|---|---|
| 2025 | $11,672 | $893,000 | $492,200 | $400,800 |
| 2024 | $11,220 | $833,600 | $464,500 | $369,100 |
| 2023 | $9,431 | $616,800 | $300,000 | $316,800 |
| 2022 | $9,173 | $551,900 | $273,100 | $278,800 |
| 2021 | $8,948 | $528,200 | $287,500 | $240,700 |
| 2020 | $8,987 | $540,400 | $292,700 | $247,700 |
| 2019 | $8,595 | $524,100 | $292,700 | $231,400 |
| 2018 | $8,344 | $498,400 | $287,500 | $210,900 |
| 2017 | $8,199 | $498,400 | $287,500 | $210,900 |
| 2016 | $8,019 | $486,000 | $287,500 | $198,500 |
| 2015 | $7,742 | $469,200 | $287,500 | $181,700 |
| 2014 | $7,204 | $440,100 | $288,100 | $152,000 |
Source: Public Records
Map
Nearby Homes
- 114 Main St
- 205 Pleasant St
- Lot 26 Webster Farm Way
- Lot 4 Webster Farm Way
- Lot 24 Webster Farm Way
- Lot 22 Webster Farm Way
- Lot 1 Webster Farm Way
- 451 Main St
- 7 Assinippi Ave Unit 216
- 11 Silver Brook Ln Unit 11
- 179 Lincoln St
- 225 Prospect St
- 21 Norwell Ave
- 731 Grove St
- 276 Woodland Dr
- 433 Grove St
- 27 Henrys Ln
- 251 Prospect St
- 0 Mount Blue St
- 479 Clapp Brook Rd