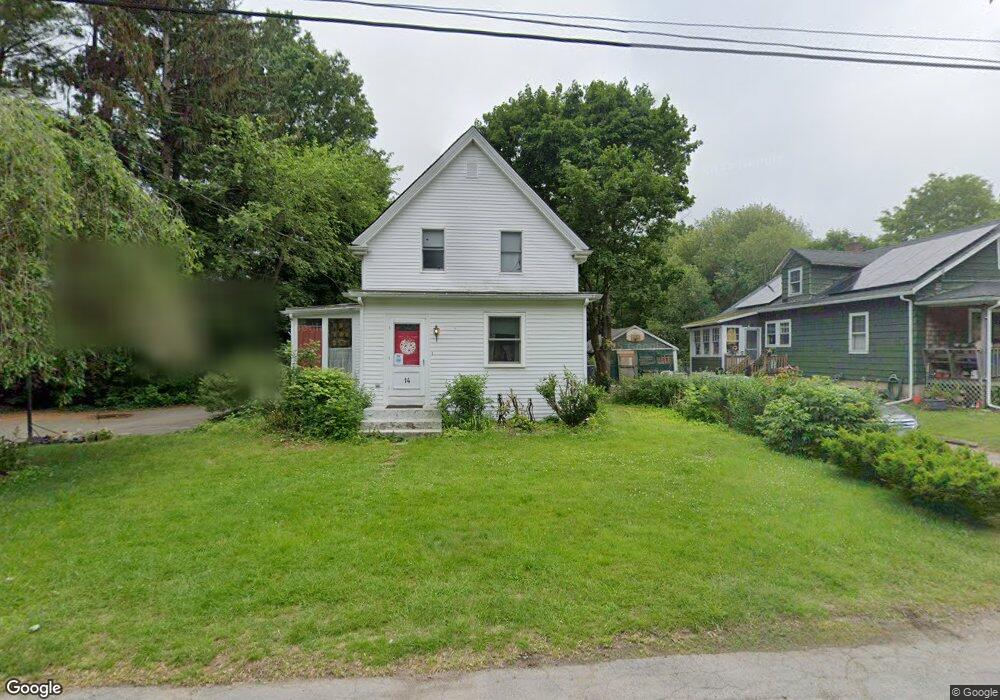
14 Sinnott St West Bridgewater, MA 02379
Estimated Value: $468,000 - $525,000
3
Beds
3
Baths
1,098
Sq Ft
$451/Sq Ft
Est. Value
About This Home
This home is located at 14 Sinnott St, West Bridgewater, MA 02379 and is currently estimated at $494,955, approximately $450 per square foot. 14 Sinnott St is a home located in Plymouth County with nearby schools including Spring Street Elementary School, Rose L. MacDonald Elementary School, and Howard Elementary School.
Ownership History
Date
Name
Owned For
Owner Type
Purchase Details
Closed on
Oct 9, 2025
Sold by
Shea Brian and Shea Lauri
Bought by
Shea Brian P
Current Estimated Value
Purchase Details
Closed on
May 25, 2001
Sold by
Department Of Housing & Urban Dev and Citiwest New England
Bought by
Shea Brian and Shea Lauri
Home Financials for this Owner
Home Financials are based on the most recent Mortgage that was taken out on this home.
Original Mortgage
$148,900
Interest Rate
7.05%
Mortgage Type
Purchase Money Mortgage
Purchase Details
Closed on
Dec 14, 1999
Sold by
Fleming Michael S and Atlantic Mtg & Invest
Bought by
Atlantic Mtg & Invest
Purchase Details
Closed on
Sep 30, 1996
Sold by
Snell Thomas P and Snell Bethann
Bought by
Fleming Michael S and Fleming Elaine M
Create a Home Valuation Report for This Property
The Home Valuation Report is an in-depth analysis detailing your home's value as well as a comparison with similar homes in the area
Home Values in the Area
Average Home Value in this Area
Purchase History
| Date | Buyer | Sale Price | Title Company |
|---|---|---|---|
| Shea Brian P | -- | -- | |
| Shea Brian | $156,751 | -- | |
| Atlantic Mtg & Invest | $131,222 | -- | |
| Fleming Michael S | $122,500 | -- |
Source: Public Records
Mortgage History
| Date | Status | Borrower | Loan Amount |
|---|---|---|---|
| Previous Owner | Fleming Michael S | $132,900 | |
| Previous Owner | Fleming Michael S | $30,000 | |
| Previous Owner | Fleming Michael S | $148,900 |
Source: Public Records
Tax History Compared to Growth
Tax History
| Year | Tax Paid | Tax Assessment Tax Assessment Total Assessment is a certain percentage of the fair market value that is determined by local assessors to be the total taxable value of land and additions on the property. | Land | Improvement |
|---|---|---|---|---|
| 2025 | $5,964 | $436,300 | $223,300 | $213,000 |
| 2024 | $5,624 | $396,900 | $202,400 | $194,500 |
| 2023 | $5,186 | $337,400 | $175,300 | $162,100 |
| 2022 | $4,817 | $297,000 | $164,800 | $132,200 |
| 2021 | $4,869 | $291,400 | $164,800 | $126,600 |
| 2020 | $4,770 | $291,400 | $164,800 | $126,600 |
| 2019 | $4,817 | $291,400 | $164,800 | $126,600 |
| 2018 | $6,462 | $274,200 | $156,500 | $117,700 |
| 2017 | $4,484 | $252,900 | $141,900 | $111,000 |
| 2016 | $4,372 | $242,900 | $131,900 | $111,000 |
| 2015 | $4,326 | $242,900 | $131,900 | $111,000 |
| 2014 | $3,967 | $240,600 | $131,900 | $108,700 |
Source: Public Records
Map
Nearby Homes
- 21 Roosevelt Ave
- 1 Fairway Dr
- 15 Fieldstone Dr
- 13 Finny's Way
- 19 Progressive Ave
- 358 Copeland St
- 1845 Main St
- Lot 1 Jeffrey Ln
- 6 Maddison
- 281 Spring St
- 16 Friendship Dr
- 18 American Ave
- 35 Longworth Ave Unit 17
- 42 Matfield St
- 47 Southworth St
- 122 N Elm St
- 1036 Ash St
- 139 Geralynn Dr
- 163 S Leyden St
- 386 Matfield St