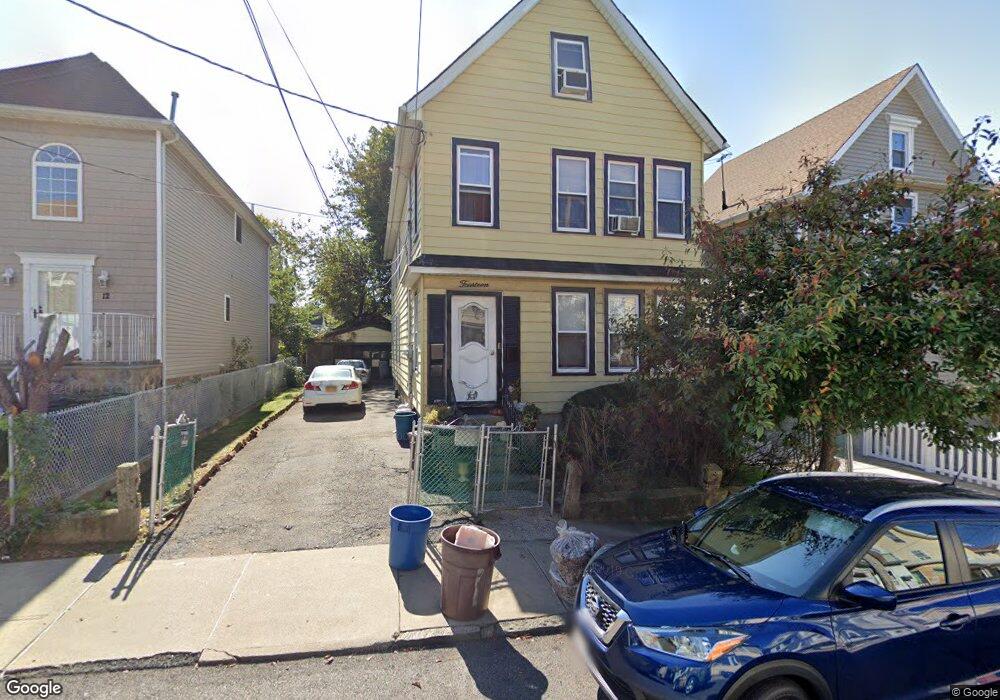
14 South St Staten Island, NY 10310
West Brighton NeighborhoodEstimated Value: $632,000 - $750,464
5
Beds
3
Baths
1,932
Sq Ft
$356/Sq Ft
Est. Value
About This Home
This home is located at 14 South St, Staten Island, NY 10310 and is currently estimated at $687,866, approximately $356 per square foot. 14 South St is a home located in Richmond County with nearby schools including P.S. 45 John Tyler, Intermediate School 27, and Susan E Wagner High School.
Ownership History
Date
Name
Owned For
Owner Type
Purchase Details
Closed on
Oct 24, 2021
Sold by
Meyers Carl R
Bought by
Holmes Makrm
Current Estimated Value
Home Financials for this Owner
Home Financials are based on the most recent Mortgage that was taken out on this home.
Original Mortgage
$240,975
Outstanding Balance
$220,410
Interest Rate
3.01%
Mortgage Type
New Conventional
Estimated Equity
$467,456
Purchase Details
Closed on
Oct 2, 2021
Sold by
Meyers Carl R
Bought by
Holmes Makrm
Home Financials for this Owner
Home Financials are based on the most recent Mortgage that was taken out on this home.
Original Mortgage
$240,975
Outstanding Balance
$220,410
Interest Rate
3.01%
Mortgage Type
New Conventional
Estimated Equity
$467,456
Purchase Details
Closed on
Jan 11, 2013
Sold by
Meyers Carl R and Meyers Marion
Bought by
Meyers Carl R
Create a Home Valuation Report for This Property
The Home Valuation Report is an in-depth analysis detailing your home's value as well as a comparison with similar homes in the area
Home Values in the Area
Average Home Value in this Area
Purchase History
| Date | Buyer | Sale Price | Title Company |
|---|---|---|---|
| Holmes Makrm | $321,300 | Mazel Abstract Llc | |
| Holmes Makrm | $321,300 | Neuberger Ned | |
| Meyers Carl R | -- | None Available |
Source: Public Records
Mortgage History
| Date | Status | Borrower | Loan Amount |
|---|---|---|---|
| Open | Holmes Makrm | $240,975 | |
| Closed | Holmes Makrm | $240,975 |
Source: Public Records
Tax History Compared to Growth
Tax History
| Year | Tax Paid | Tax Assessment Tax Assessment Total Assessment is a certain percentage of the fair market value that is determined by local assessors to be the total taxable value of land and additions on the property. | Land | Improvement |
|---|---|---|---|---|
| 2025 | $4,660 | $43,680 | $7,567 | $36,113 |
| 2024 | $3,060 | $35,700 | $8,734 | $26,966 |
| 2023 | $4,445 | $21,888 | $7,085 | $14,803 |
| 2022 | $4,370 | $33,780 | $13,440 | $20,340 |
| 2021 | $4,572 | $30,240 | $13,440 | $16,800 |
| 2020 | $4,338 | $27,900 | $13,440 | $14,460 |
| 2019 | $4,045 | $25,680 | $13,440 | $12,240 |
| 2018 | $3,718 | $18,240 | $13,440 | $4,800 |
| 2017 | $4,146 | $20,340 | $13,440 | $6,900 |
| 2016 | $3,838 | $19,200 | $13,440 | $5,760 |
| 2015 | $3,777 | $20,860 | $13,247 | $7,613 |
| 2014 | $3,777 | $19,680 | $13,260 | $6,420 |
Source: Public Records
Map
Nearby Homes
- 386 N Burgher Ave
- 56 South St
- 361 Broadway
- 305 Broadway
- 555 Delafield Ave
- 1001 Castleton Ave
- 943 Castleton Ave
- 1064 Castleton Ave
- 46 Winegar Ln
- 335 Oakland Ave
- 331 Oakland Ave
- 207 N Burgher Ave
- 432 Pelton Ave
- 698 Henderson Ave
- 718 Henderson Ave
- 46 Elizabeth St
- 657 Delafield Ave
- 582 Cary Ave
- 123 Roe St
- 699 Henderson Ave