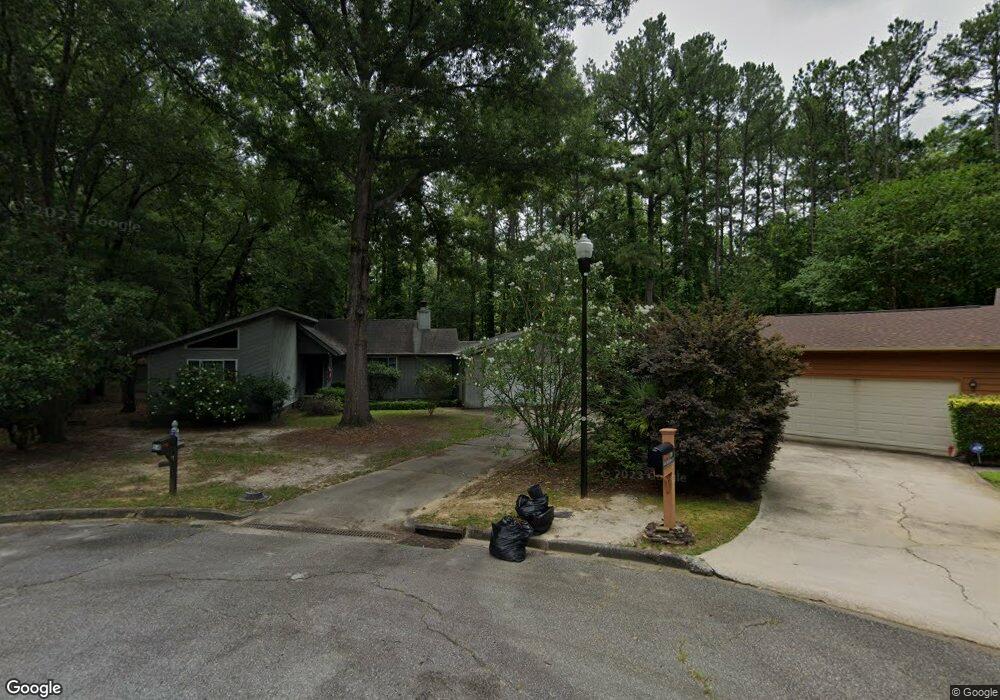
14 Southfern Ct Columbia, SC 29212
Saint Andrews NeighborhoodEstimated Value: $172,000 - $227,000
3
Beds
2
Baths
1,460
Sq Ft
$142/Sq Ft
Est. Value
About This Home
This home is located at 14 Southfern Ct, Columbia, SC 29212 and is currently estimated at $206,701, approximately $141 per square foot. 14 Southfern Ct is a home located in Richland County with nearby schools including Pine Grove Elementary School, St. Andrews Middle School, and Columbia High School.
Ownership History
Date
Name
Owned For
Owner Type
Purchase Details
Closed on
Aug 23, 2021
Sold by
Johnson Donald W and Grimes Tawayla
Bought by
Grimes Kenneth R and Grimes Tawayla M
Current Estimated Value
Home Financials for this Owner
Home Financials are based on the most recent Mortgage that was taken out on this home.
Original Mortgage
$140,000
Outstanding Balance
$126,918
Interest Rate
2.7%
Mortgage Type
VA
Estimated Equity
$79,783
Purchase Details
Closed on
Jul 30, 2007
Sold by
Greene Drinda L
Bought by
Johnson Donald W and Grimes Tawayla
Home Financials for this Owner
Home Financials are based on the most recent Mortgage that was taken out on this home.
Original Mortgage
$128,250
Interest Rate
6.65%
Mortgage Type
Purchase Money Mortgage
Purchase Details
Closed on
May 28, 2006
Sold by
Greene Drinda L
Bought by
Greene Drinda L
Purchase Details
Closed on
Aug 31, 2004
Sold by
Patrone Ann H and Bell Ann
Bought by
Greene John S and Greene Drinda L
Create a Home Valuation Report for This Property
The Home Valuation Report is an in-depth analysis detailing your home's value as well as a comparison with similar homes in the area
Home Values in the Area
Average Home Value in this Area
Purchase History
| Date | Buyer | Sale Price | Title Company |
|---|---|---|---|
| Grimes Kenneth R | $140,000 | None Available | |
| Johnson Donald W | $135,500 | None Available | |
| Greene Drinda L | -- | None Available | |
| Greene John S | $106,900 | -- |
Source: Public Records
Mortgage History
| Date | Status | Borrower | Loan Amount |
|---|---|---|---|
| Open | Grimes Kenneth R | $140,000 | |
| Previous Owner | Johnson Donald W | $128,250 |
Source: Public Records
Tax History Compared to Growth
Tax History
| Year | Tax Paid | Tax Assessment Tax Assessment Total Assessment is a certain percentage of the fair market value that is determined by local assessors to be the total taxable value of land and additions on the property. | Land | Improvement |
|---|---|---|---|---|
| 2024 | $1,494 | $161,000 | $0 | $0 |
| 2023 | $1,494 | $5,600 | $0 | $0 |
| 2022 | $3,969 | $140,000 | $20,000 | $120,000 |
| 2021 | $1,166 | $4,820 | $0 | $0 |
| 2020 | $1,213 | $4,820 | $0 | $0 |
| 2019 | $1,187 | $4,820 | $0 | $0 |
| 2018 | $948 | $4,200 | $0 | $0 |
| 2017 | $927 | $4,200 | $0 | $0 |
| 2016 | $923 | $4,200 | $0 | $0 |
| 2015 | $927 | $4,200 | $0 | $0 |
| 2014 | $925 | $104,900 | $0 | $0 |
| 2013 | -- | $4,200 | $0 | $0 |
Source: Public Records
Map
Nearby Homes
- 13 Spring Pine Ct
- 11 Spring Pine Ct
- 18 Southpine Ct
- 123 Winding Chestnut Dr
- 119 Winding Chestnut Dr
- 117 Winding Chestnut Dr
- 122 Winding Chestnut Dr
- 124 Winding Chestnut Dr
- 125 Winding Chestnut Dr
- 127 Winding Chestnut Dr
- 15 Woodpine Ct
- 338 Ryegrass Way
- 340 Ryegrass Way
- 21 Colony House Ct
- 110 Prairie Grass Way
- 102 Prairie Grass Way
- 108 Prairie Grass Way
- 114 Prairie Grass Way
- 119 Prairie Grass Way
- 104 Prairie Grass Way
- 18 Southfern Ct
- 10 Southfern Ct
- 149 Chinquapin Cir
- 22 Southfern Ct
- 6 S Oak Ct
- 10 S Oak Ct
- 6 Southfern Ct
- 153 Chinquapin Cir
- 145 Chinquapin Cir
- 2 Southfern Ct
- 157 Chinquapin Cir
- 14 S Oak Ct
- 141 Chinquapin Cir
- 18 Southgrove Ct
- 146 Chinquapin Cir
- 2 S Oak Ct
- 1 Northfern Ct
- 1 Northfern Ct
- 22 Southgrove Ct
- 18 S Oak Ct