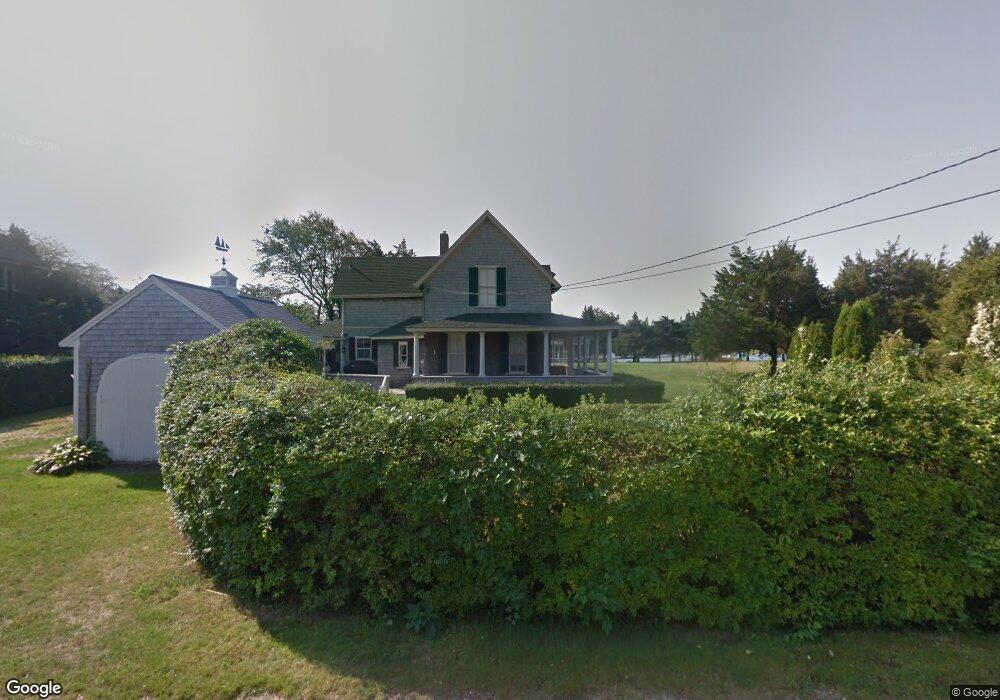
14 Swift St Falmouth, MA 02540
Estimated Value: $1,937,393 - $2,028,000
3
Beds
3
Baths
1,346
Sq Ft
$1,476/Sq Ft
Est. Value
About This Home
This home is located at 14 Swift St, Falmouth, MA 02540 and is currently estimated at $1,987,348, approximately $1,476 per square foot. 14 Swift St is a home located in Barnstable County with nearby schools including North Falmouth Elementary School, Morse Pond School, and Lawrence School.
Ownership History
Date
Name
Owned For
Owner Type
Purchase Details
Closed on
Sep 12, 2024
Sold by
14 Swift St Llc
Bought by
14 Swift Falmouth Llc
Current Estimated Value
Purchase Details
Closed on
Feb 10, 2020
Sold by
Egan Kevin M and Egan Stefanie B
Bought by
14 Swift Street Llc
Purchase Details
Closed on
Jul 10, 2014
Sold by
Boswell Lindsay A and Davis Matthew J
Bought by
Egan Kevin M and Egan Stefanie B
Home Financials for this Owner
Home Financials are based on the most recent Mortgage that was taken out on this home.
Original Mortgage
$450,000
Interest Rate
3%
Mortgage Type
Purchase Money Mortgage
Purchase Details
Closed on
May 13, 2008
Sold by
Angelini Marie A and Angelini Michael P
Bought by
Boswell Lindsay Alice and Boswell David Matthew
Purchase Details
Closed on
Dec 29, 1995
Sold by
Angelini Michael P
Bought by
Brown George T and Brown Zylpha
Purchase Details
Closed on
Feb 24, 1995
Sold by
Judith B Ammen T B and Judith Ammen
Bought by
Angelini Michael P
Create a Home Valuation Report for This Property
The Home Valuation Report is an in-depth analysis detailing your home's value as well as a comparison with similar homes in the area
Home Values in the Area
Average Home Value in this Area
Purchase History
| Date | Buyer | Sale Price | Title Company |
|---|---|---|---|
| 14 Swift Falmouth Llc | $2,050,000 | None Available | |
| 14 Swift Falmouth Llc | $2,050,000 | None Available | |
| 14 Swift Falmouth Llc | $2,050,000 | None Available | |
| 14 Swift Street Llc | -- | None Available | |
| 14 Swift Street Llc | -- | None Available | |
| Egan Kevin M | $1,050,000 | -- | |
| Boswell Lindsay Alice | $925,000 | -- | |
| Brown George T | $60,000 | -- | |
| Angelini Michael P | $272,500 | -- | |
| Egan Kevin M | $1,050,000 | -- | |
| Boswell Lindsay Alice | $925,000 | -- | |
| Brown George T | $60,000 | -- | |
| Angelini Michael P | $272,500 | -- |
Source: Public Records
Mortgage History
| Date | Status | Borrower | Loan Amount |
|---|---|---|---|
| Previous Owner | Egan Kevin M | $450,000 |
Source: Public Records
Tax History Compared to Growth
Tax History
| Year | Tax Paid | Tax Assessment Tax Assessment Total Assessment is a certain percentage of the fair market value that is determined by local assessors to be the total taxable value of land and additions on the property. | Land | Improvement |
|---|---|---|---|---|
| 2025 | $9,991 | $1,702,100 | $1,327,400 | $374,700 |
| 2024 | $9,342 | $1,487,600 | $1,154,300 | $333,300 |
| 2023 | $10,130 | $1,463,900 | $1,154,300 | $309,600 |
| 2022 | $8,849 | $1,099,300 | $825,600 | $273,700 |
| 2021 | $9,039 | $1,063,400 | $789,700 | $273,700 |
| 2020 | $8,518 | $991,600 | $717,900 | $273,700 |
| 2019 | $8,387 | $979,800 | $717,900 | $261,900 |
| 2018 | $8,284 | $963,200 | $717,900 | $245,300 |
| 2017 | $8,025 | $940,800 | $717,900 | $222,900 |
| 2016 | $7,801 | $932,000 | $717,900 | $214,100 |
| 2015 | $7,054 | $861,300 | $652,400 | $208,900 |
| 2014 | $6,654 | $816,500 | $652,500 | $164,000 |
Source: Public Records
Map
Nearby Homes