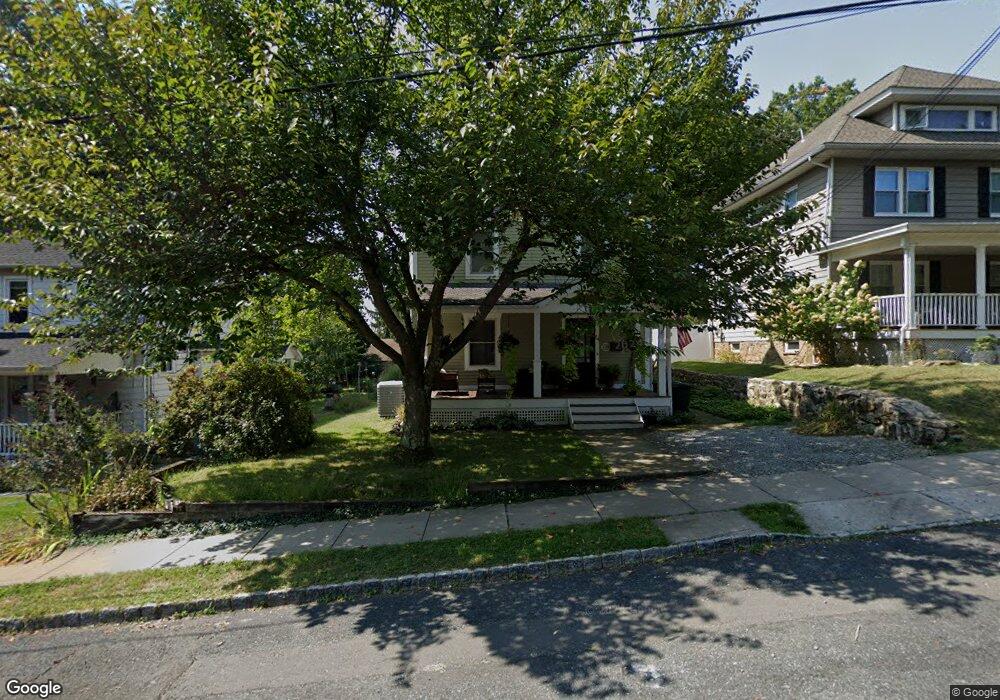
14 Thomas St High Bridge, NJ 08829
Estimated Value: $447,000 - $512,000
Studio
--
Bath
1,776
Sq Ft
$276/Sq Ft
Est. Value
About This Home
This home is located at 14 Thomas St, High Bridge, NJ 08829 and is currently estimated at $490,143, approximately $275 per square foot. 14 Thomas St is a home located in Hunterdon County with nearby schools including High Bridge Elementary School, High Bridge Middle School, and Voorhees High School.
Ownership History
Date
Name
Owned For
Owner Type
Purchase Details
Closed on
Jan 20, 2001
Sold by
Lawler Robert E
Bought by
Schwartz Alan E
Current Estimated Value
Home Financials for this Owner
Home Financials are based on the most recent Mortgage that was taken out on this home.
Original Mortgage
$186,750
Outstanding Balance
$66,903
Interest Rate
7.14%
Estimated Equity
$423,240
Purchase Details
Closed on
Oct 16, 1998
Sold by
Galinsky Andrew
Bought by
Lawler Robert E and Lawler Elise A
Home Financials for this Owner
Home Financials are based on the most recent Mortgage that was taken out on this home.
Original Mortgage
$157,200
Interest Rate
6.8%
Purchase Details
Closed on
Apr 20, 1995
Sold by
Mcalister Terry T and Mcalister Angela Walker
Bought by
Galinsky Andrew and Galinsky Norma Melendez
Purchase Details
Closed on
Apr 19, 1989
Sold by
Steiner John R and Steiner Theresa J
Bought by
Mcalister Terry T and Mcalister Angela W
Create a Home Valuation Report for This Property
The Home Valuation Report is an in-depth analysis detailing your home's value as well as a comparison with similar homes in the area
Home Values in the Area
Average Home Value in this Area
Purchase History
| Date | Buyer | Sale Price | Title Company |
|---|---|---|---|
| Schwartz Alan E | $207,500 | -- | |
| Lawler Robert E | $165,500 | -- | |
| Galinsky Andrew | $171,000 | -- | |
| Mcalister Terry T | $154,000 | -- |
Source: Public Records
Mortgage History
| Date | Status | Borrower | Loan Amount |
|---|---|---|---|
| Open | Schwartz Alan E | $186,750 | |
| Previous Owner | Lawler Robert E | $157,200 |
Source: Public Records
Tax History
| Year | Tax Paid | Tax Assessment Tax Assessment Total Assessment is a certain percentage of the fair market value that is determined by local assessors to be the total taxable value of land and additions on the property. | Land | Improvement |
|---|---|---|---|---|
| 2025 | $15,886 | $427,000 | $136,300 | $290,700 |
| 2024 | $13,882 | $486,700 | $107,800 | $378,900 |
Source: Public Records
Map
Nearby Homes
- 13 Fairview Ave
- 77 Main St
- 10 Timbercroft Rd
- 21 E Main St
- 44 Beavers St
- 0 Beavers St
- 5 Deer Run Dr
- 56 E Main St
- 69 Beavers St
- 3 Chestnut Ct
- 2 Berrywood Ln
- 15 Patton St
- 521 Cokesbury Rd
- 128 Annandale High Bridge Rd
- 8 Appollo Place
- 9 Charles Ct
- 102-104 Cokesbury Rd
- 16 Perry Rd
- 3 Fulper Place
- 22 Fairview Ave
Your Personal Tour Guide
Ask me questions while you tour the home.