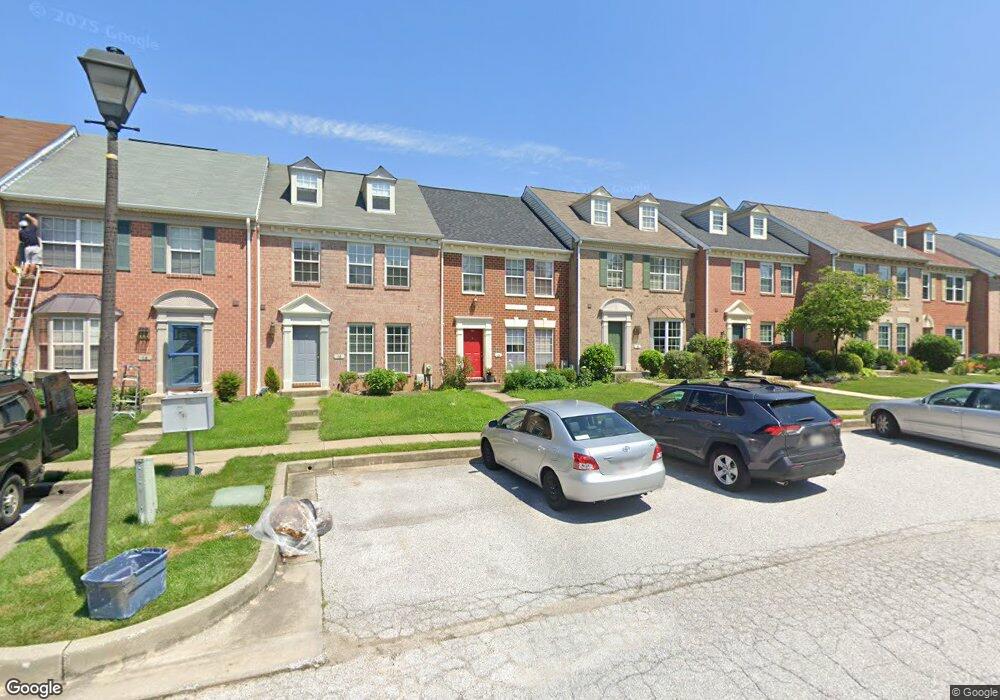
14 Tigreff Ct Parkville, MD 21234
Estimated Value: $350,000 - $379,000
--
Bed
3
Baths
1,428
Sq Ft
$257/Sq Ft
Est. Value
About This Home
This home is located at 14 Tigreff Ct, Parkville, MD 21234 and is currently estimated at $366,499, approximately $256 per square foot. 14 Tigreff Ct is a home located in Baltimore County with nearby schools including Pine Grove Elementary School, Pine Grove Middle School, and Loch Raven High.
Ownership History
Date
Name
Owned For
Owner Type
Purchase Details
Closed on
Nov 30, 2007
Sold by
Shrestha Nina
Bought by
Shrestha Nina and Shrestha Shyam Krishna
Current Estimated Value
Purchase Details
Closed on
Nov 28, 2007
Sold by
Shrestha Nina
Bought by
Shrestha Nina and Shrestha Shyam Krishna
Purchase Details
Closed on
Aug 17, 2007
Sold by
Hewitt Sharon D
Bought by
Shrestha Nina
Home Financials for this Owner
Home Financials are based on the most recent Mortgage that was taken out on this home.
Original Mortgage
$56,400
Interest Rate
6.24%
Mortgage Type
Stand Alone Second
Purchase Details
Closed on
Jan 31, 2007
Sold by
Hewitt Sharon D
Bought by
Shrestha Nina
Home Financials for this Owner
Home Financials are based on the most recent Mortgage that was taken out on this home.
Original Mortgage
$225,600
Interest Rate
7.6%
Mortgage Type
Purchase Money Mortgage
Purchase Details
Closed on
Feb 9, 1989
Sold by
Cromwell Station Joint Venture
Bought by
Hewitt Sharon D
Create a Home Valuation Report for This Property
The Home Valuation Report is an in-depth analysis detailing your home's value as well as a comparison with similar homes in the area
Home Values in the Area
Average Home Value in this Area
Purchase History
| Date | Buyer | Sale Price | Title Company |
|---|---|---|---|
| Shrestha Nina | -- | -- | |
| Shrestha Nina | -- | -- | |
| Shrestha Nina | $282,000 | -- | |
| Shrestha Nina | $282,000 | -- | |
| Hewitt Sharon D | $118,000 | -- |
Source: Public Records
Mortgage History
| Date | Status | Borrower | Loan Amount |
|---|---|---|---|
| Previous Owner | Shrestha Nina | $56,400 | |
| Previous Owner | Shrestha Nina | $225,600 | |
| Previous Owner | Shrestha Nina | $225,600 |
Source: Public Records
Tax History Compared to Growth
Tax History
| Year | Tax Paid | Tax Assessment Tax Assessment Total Assessment is a certain percentage of the fair market value that is determined by local assessors to be the total taxable value of land and additions on the property. | Land | Improvement |
|---|---|---|---|---|
| 2025 | $4,507 | $296,900 | $94,000 | $202,900 |
| 2024 | $4,507 | $277,567 | $0 | $0 |
| 2023 | $2,024 | $258,233 | $0 | $0 |
| 2022 | $3,882 | $238,900 | $94,000 | $144,900 |
| 2021 | $3,777 | $238,900 | $94,000 | $144,900 |
| 2020 | $3,777 | $238,900 | $94,000 | $144,900 |
| 2019 | $4,118 | $249,800 | $94,000 | $155,800 |
| 2018 | $3,993 | $246,167 | $0 | $0 |
| 2017 | $3,822 | $242,533 | $0 | $0 |
| 2016 | $3,462 | $238,900 | $0 | $0 |
| 2015 | $3,462 | $236,467 | $0 | $0 |
| 2014 | $3,462 | $234,033 | $0 | $0 |
Source: Public Records
Map
Nearby Homes
- 2215 Lowells Glen Rd Unit J
- 10 Class Ct
- 9106 Covered Bridge Rd
- 1905 Haverhill Rd
- 1812 Dunwoody Cir
- 8808 Littlewood Rd
- 2314 Covered Bridge Garth
- 16 Pinecone Ct
- 19 Skywood Ct
- 8802 Ashford Rd
- 9006 Wood Park Ct
- 8739 Cimarron Cir
- 1870 Yakona Rd
- 1862 Yakona Rd
- 2647 Ebony Rd
- 3 Chimney Hearth Ct
- 2410 Woodcroft Rd
- 8656 Oak Rd
- 2431 Lakewood Rd
- 2329 Foster Ave
- 16 Tigreff Ct
- 12 Tigreff Ct
- 18 Tigreff Ct
- 8 Tigreff Ct
- 20 Tigreff Ct
- 21 Roger Valley Ct
- 23 Roger Valley Ct
- 19 Roger Valley Ct
- 25 Roger Valley Ct
- 22 Tigreff Ct
- 17 Roger Valley Ct
- 27 Roger Valley Ct
- 2 Tigreff Ct
- 15 Roger Valley Ct
- 24 Tigreff Ct
- 29 Roger Valley Ct
- 13 Roger Valley Ct
- 1 Tigreff Ct
- 26 Tigreff Ct
- 3 Tigreff Ct