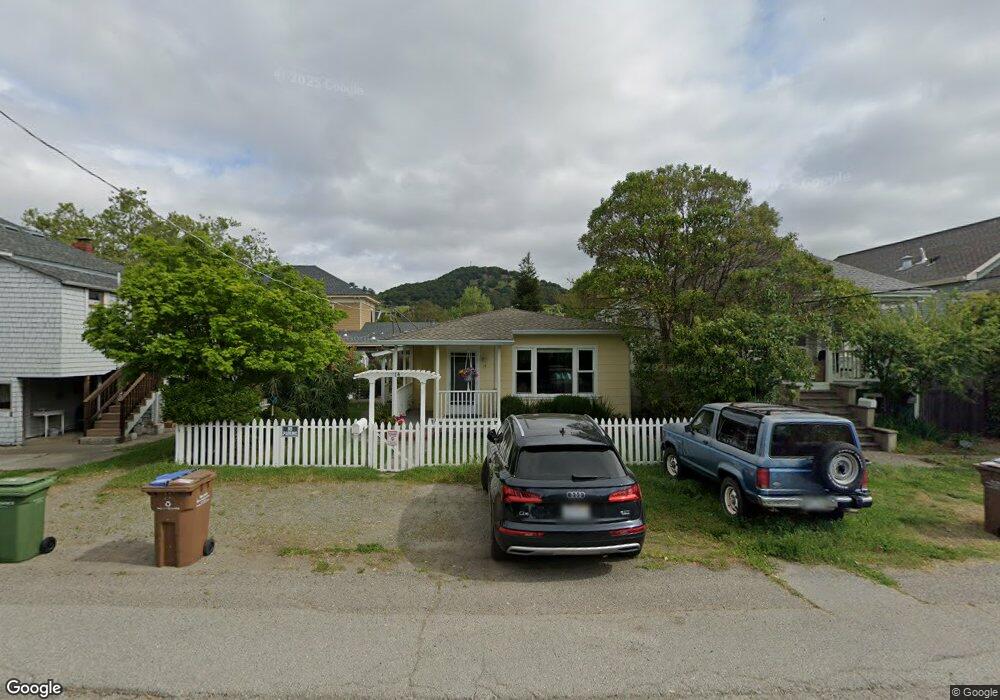
14 Treanor St San Rafael, CA 94901
Gerstle Park NeighborhoodEstimated Value: $631,009 - $970,000
2
Beds
1
Bath
841
Sq Ft
$907/Sq Ft
Est. Value
About This Home
This home is located at 14 Treanor St, San Rafael, CA 94901 and is currently estimated at $762,502, approximately $906 per square foot. 14 Treanor St is a home located in Marin County with nearby schools including Laurel Dell Elementary School, James B. Davidson Middle School, and San Rafael High School.
Ownership History
Date
Name
Owned For
Owner Type
Purchase Details
Closed on
Oct 18, 2016
Sold by
Bottarini Bonnie
Bought by
Bottarini Bonnie R and Bottarini Kaufman 2016 Revocab
Current Estimated Value
Purchase Details
Closed on
Aug 30, 2016
Sold by
Bottarini Richard
Bought by
Bottarini Richard T and Bottarini Revocable Trust
Purchase Details
Closed on
Dec 16, 2015
Sold by
Bottarini Richard and Bottarini Bonnie
Bought by
Bottarini Richard and Bottarini Bonnie
Purchase Details
Closed on
Jan 14, 2003
Sold by
Bottarini Richard C
Bought by
Bottarini Richard C and Bottarini Velmar
Create a Home Valuation Report for This Property
The Home Valuation Report is an in-depth analysis detailing your home's value as well as a comparison with similar homes in the area
Home Values in the Area
Average Home Value in this Area
Purchase History
We collect this data history from publicly available records. To have your information removed, we recommend requesting removal directly through your county’s website.
| Date | Buyer | Sale Price | Title Company |
|---|---|---|---|
| Bottarini Bonnie R | -- | None Available | |
| Bottarini Richard T | -- | None Available | |
| Bottarini Richard | -- | None Available | |
| Bottarini Richard C | -- | -- |
Source: Public Records
Tax History
| Year | Tax Paid | Tax Assessment Tax Assessment Total Assessment is a certain percentage of the fair market value that is determined by local assessors to be the total taxable value of land and additions on the property. | Land | Improvement |
|---|---|---|---|---|
| 2025 | $3,277 | $90,276 | $38,603 | $51,673 |
| 2024 | $3,063 | $88,507 | $37,847 | $50,660 |
| 2023 | $2,928 | $86,772 | $37,105 | $49,667 |
| 2022 | $2,837 | $85,070 | $36,377 | $48,693 |
| 2021 | $2,561 | $63,403 | $35,664 | $27,739 |
| 2020 | $2,483 | $62,752 | $35,298 | $27,454 |
| 2019 | $2,356 | $61,522 | $34,606 | $26,916 |
| 2018 | $2,326 | $60,316 | $33,928 | $26,388 |
| 2017 | $2,271 | $59,134 | $33,263 | $25,871 |
| 2016 | $2,172 | $57,975 | $32,611 | $25,364 |
| 2015 | $2,084 | $57,104 | $32,121 | $24,983 |
| 2014 | $1,968 | $55,975 | $31,487 | $24,488 |
Source: Public Records
Map
Nearby Homes
- 226 Bayview St
- 46 Martens Blvd
- 59, 60 Clayton St
- 31 Martens Blvd
- 11 San Rafael Ave
- 135 Martens Blvd
- 27 Latham St
- 1547 4th St Unit A
- 39 Latham St
- 21 Woods St
- 111 C St
- 183 Reservoir Rd
- 12 Estates Ct
- 820 Mission Ave Unit 4
- 820 Mission Ave Unit 7
- 180 El Cerrito Ave
- 351 G St
- 51 El Camino Ave
- 1836 5th Ave
- 8 Center St
Your Personal Tour Guide
Ask me questions while you tour the home.