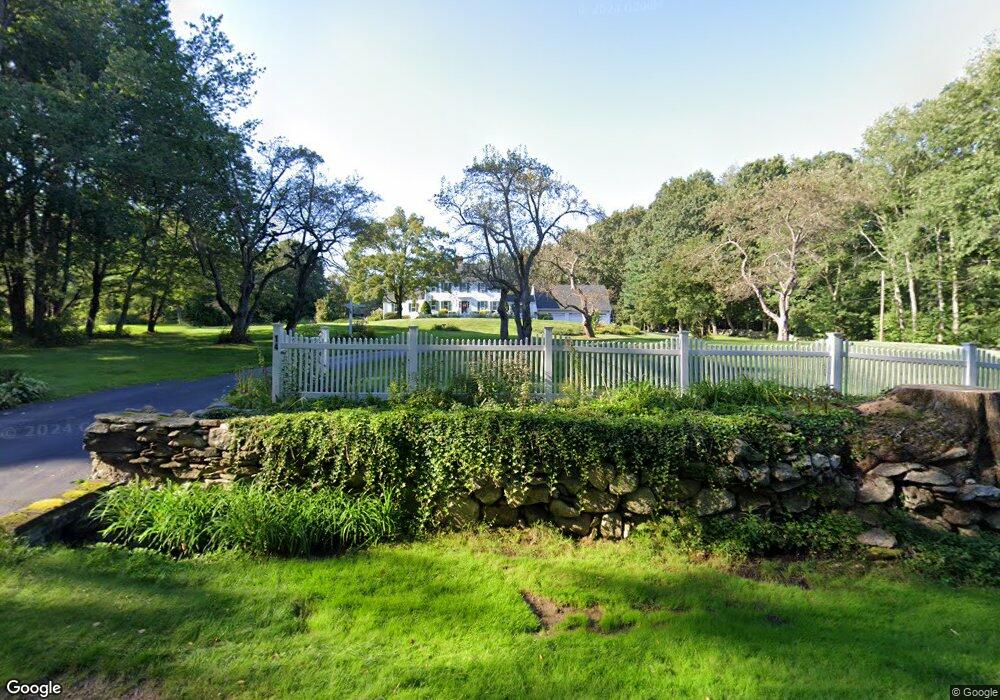
14 Tucker Rd Charlton, MA 01507
Estimated Value: $709,927 - $856,000
4
Beds
3
Baths
3,836
Sq Ft
$204/Sq Ft
Est. Value
About This Home
This home is located at 14 Tucker Rd, Charlton, MA 01507 and is currently estimated at $781,732, approximately $203 per square foot. 14 Tucker Rd is a home located in Worcester County with nearby schools including Shepherd Hill Regional High School.
Ownership History
Date
Name
Owned For
Owner Type
Purchase Details
Closed on
Dec 13, 2022
Sold by
Stepien Douglas A and Stepien Sylvia J
Bought by
Stepien Ft - 2022 and Stepien
Current Estimated Value
Purchase Details
Closed on
Nov 21, 1996
Sold by
Morrill Frank J and Morrill Lenore
Bought by
Stepien Douglas A and Stepien Sylvia J
Create a Home Valuation Report for This Property
The Home Valuation Report is an in-depth analysis detailing your home's value as well as a comparison with similar homes in the area
Home Values in the Area
Average Home Value in this Area
Purchase History
| Date | Buyer | Sale Price | Title Company |
|---|---|---|---|
| Stepien Ft - 2022 | -- | None Available | |
| Stepien Ft - 2022 | -- | None Available | |
| Stepien Douglas A | $237,900 | -- | |
| Stepien Douglas A | $237,900 | -- |
Source: Public Records
Mortgage History
| Date | Status | Borrower | Loan Amount |
|---|---|---|---|
| Previous Owner | Stepien Douglas A | $75,000 | |
| Previous Owner | Stepien Douglas A | $97,000 | |
| Previous Owner | Stepien Douglas A | $97,000 |
Source: Public Records
Tax History
| Year | Tax Paid | Tax Assessment Tax Assessment Total Assessment is a certain percentage of the fair market value that is determined by local assessors to be the total taxable value of land and additions on the property. | Land | Improvement |
|---|---|---|---|---|
| 2025 | $7,356 | $660,900 | $94,400 | $566,500 |
| 2024 | $7,203 | $635,200 | $94,100 | $541,100 |
| 2023 | $7,039 | $578,400 | $89,900 | $488,500 |
| 2022 | $7,505 | $564,700 | $81,700 | $483,000 |
| 2021 | $7,227 | $481,500 | $77,500 | $404,000 |
| 2020 | $6,913 | $462,700 | $74,500 | $388,200 |
| 2019 | $6,834 | $462,700 | $74,500 | $388,200 |
| 2018 | $6,246 | $462,700 | $74,500 | $388,200 |
| 2017 | $6,557 | $465,000 | $68,500 | $396,500 |
| 2016 | $6,408 | $465,000 | $68,500 | $396,500 |
| 2015 | $6,240 | $465,000 | $68,500 | $396,500 |
| 2014 | $5,976 | $472,000 | $71,100 | $400,900 |
Source: Public Records
Map
Nearby Homes
- 8 Hycrest Rd
- 7 Hycrest Rd
- 4 N Meadow Ln
- 0 Hammond Hill Rd
- 1 Cole Dr Unit 1
- Lot 2 Gould Rd
- Lot 1 Gould Rd
- Lot 3 Gould Rd
- Lot 9 Gould Rd
- Lot 4 Gould Rd
- Lot 5 Gould Rd
- 40 Carroll Hill Rd
- 94 Clark Rd
- 6 Laurelwood Dr
- 0 Oxbow Rd
- 50 Old Spencer Rd
- 24 Thayer Pond Dr Unit 17
- 45 Leicester St
- 34 Thayer Pond Dr Unit 8
- 4 Thayer Pond Dr Unit 20
Your Personal Tour Guide
Ask me questions while you tour the home.