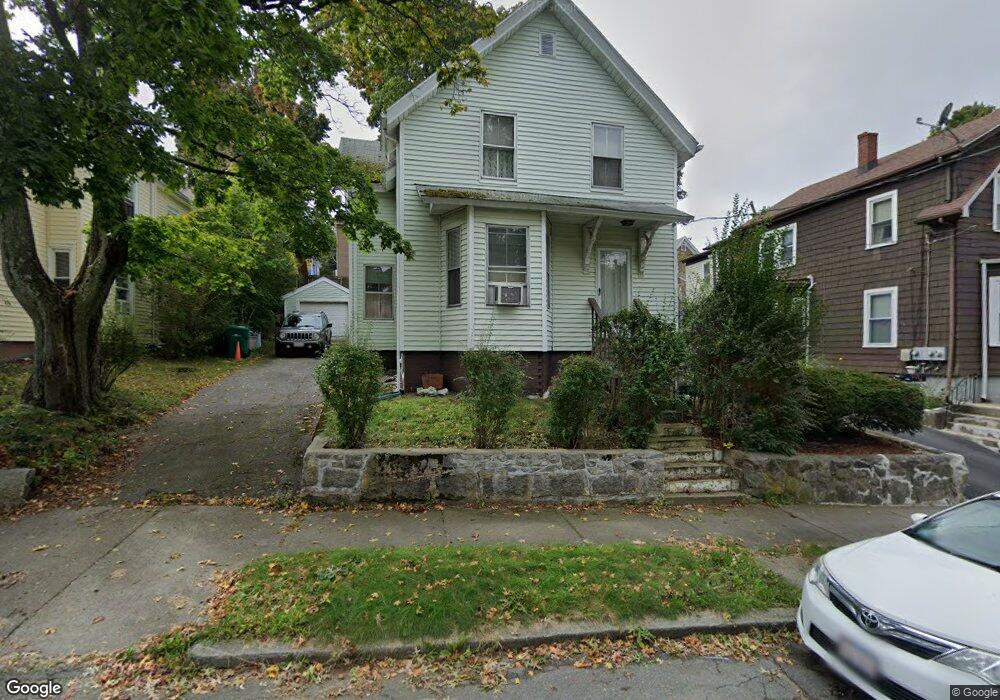
14 Tucker St Lynn, MA 01902
Agganis AC NeighborhoodEstimated Value: $490,273 - $532,000
3
Beds
2
Baths
1,272
Sq Ft
$399/Sq Ft
Est. Value
About This Home
This home is located at 14 Tucker St, Lynn, MA 01902 and is currently estimated at $507,068, approximately $398 per square foot. 14 Tucker St is a home located in Essex County with nearby schools including Robert L. Ford Elementary School, William R. Fallon School, and Pickering Middle School.
Ownership History
Date
Name
Owned For
Owner Type
Purchase Details
Closed on
Aug 14, 2013
Sold by
Muchmore Ft
Bought by
Muchmore Michael J and Muchmore Mary E
Current Estimated Value
Purchase Details
Closed on
Aug 27, 2012
Sold by
Muchmore Rita F
Bought by
Muchmore Ft
Purchase Details
Closed on
Nov 18, 1985
Bought by
Muchmore Michael J and Muchmore Mary Elle
Create a Home Valuation Report for This Property
The Home Valuation Report is an in-depth analysis detailing your home's value as well as a comparison with similar homes in the area
Home Values in the Area
Average Home Value in this Area
Purchase History
| Date | Buyer | Sale Price | Title Company |
|---|---|---|---|
| Muchmore Michael J | -- | -- | |
| Muchmore Michael J | -- | -- | |
| Muchmore Ft | -- | -- | |
| Muchmore Ft | -- | -- | |
| Muchmore Michael J | -- | -- |
Source: Public Records
Mortgage History
| Date | Status | Borrower | Loan Amount |
|---|---|---|---|
| Previous Owner | Muchmore Michael J | $15,000 |
Source: Public Records
Tax History
| Year | Tax Paid | Tax Assessment Tax Assessment Total Assessment is a certain percentage of the fair market value that is determined by local assessors to be the total taxable value of land and additions on the property. | Land | Improvement |
|---|---|---|---|---|
| 2025 | $4,826 | $465,800 | $198,100 | $267,700 |
| 2024 | $4,546 | $431,700 | $178,800 | $252,900 |
| 2023 | $4,464 | $400,400 | $178,800 | $221,600 |
| 2022 | $4,283 | $344,600 | $146,200 | $198,400 |
| 2021 | $4,151 | $318,600 | $133,400 | $185,200 |
| 2020 | $3,684 | $274,900 | $104,200 | $170,700 |
| 2019 | $3,752 | $262,400 | $101,600 | $160,800 |
| 2018 | $3,530 | $233,000 | $98,200 | $134,800 |
| 2017 | $3,171 | $203,300 | $76,300 | $127,000 |
| 2016 | $2,984 | $184,400 | $64,300 | $120,100 |
| 2015 | $2,918 | $174,200 | $69,000 | $105,200 |
Source: Public Records
Map
Nearby Homes
- 5 Rockingham St
- 70 Grant St
- 12 W Colony Rd
- 70 Allen Ave
- 154-156 Tracy Ave
- 325 Western Ave
- 12 Eade St
- 6A Goodridge St
- 135 Allen Ave
- 129 Eutaw Ave
- 345 Western Ave
- 7 Ward St
- 10 Pond St
- 2 Chestnut Terrace
- 69 Hollingsworth St Unit 69A
- 431-433 Chatham St
- 531 A Chatham St
- 90 Sheridan St
- 102 Rockaway St
- 131 Adams St
Your Personal Tour Guide
Ask me questions while you tour the home.