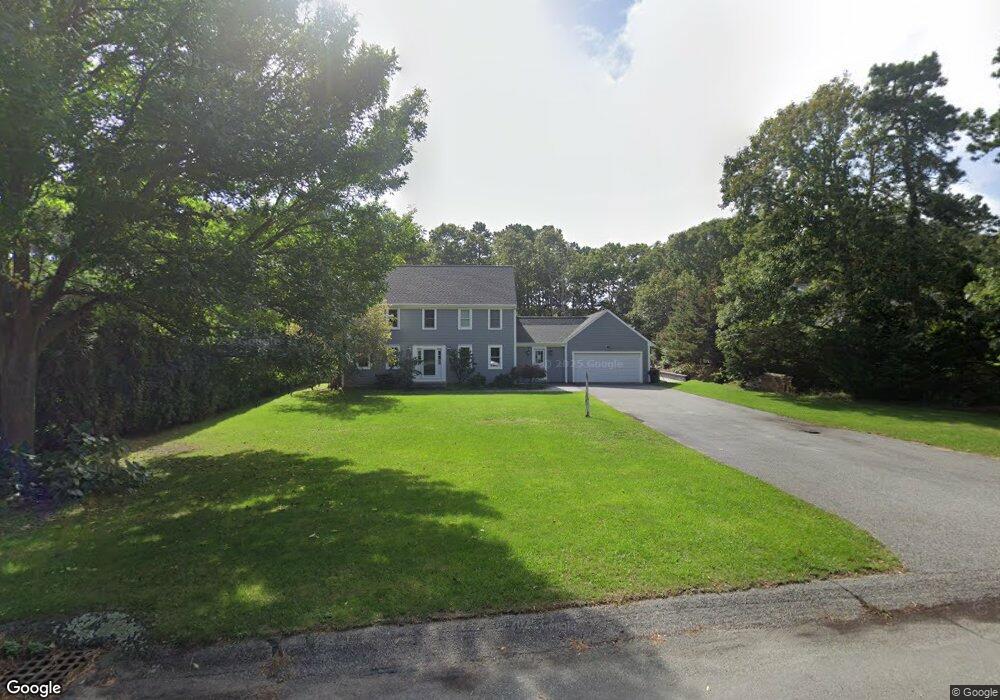
14 Tupelo Dr Harwich, MA 02645
Northwest Harwich NeighborhoodEstimated Value: $828,000 - $994,000
3
Beds
4
Baths
2,380
Sq Ft
$383/Sq Ft
Est. Value
About This Home
This home is located at 14 Tupelo Dr, Harwich, MA 02645 and is currently estimated at $911,891, approximately $383 per square foot. 14 Tupelo Dr is a home located in Barnstable County with nearby schools including Harwich Elementary School, Chatham Elementary School, and Monomoy Regional Middle School.
Ownership History
Date
Name
Owned For
Owner Type
Purchase Details
Closed on
Sep 24, 2009
Sold by
Kaldis-Thompson Mary
Bought by
Mkt Ft and Kaldis-Thompson Mary
Current Estimated Value
Purchase Details
Closed on
Jun 19, 1996
Sold by
Cameles Zoe
Bought by
Thompson Mary K
Home Financials for this Owner
Home Financials are based on the most recent Mortgage that was taken out on this home.
Original Mortgage
$110,000
Interest Rate
8.24%
Create a Home Valuation Report for This Property
The Home Valuation Report is an in-depth analysis detailing your home's value as well as a comparison with similar homes in the area
Home Values in the Area
Average Home Value in this Area
Purchase History
| Date | Buyer | Sale Price | Title Company |
|---|---|---|---|
| Mkt Ft | -- | -- | |
| Thompson Mary K | $30,000 | -- |
Source: Public Records
Mortgage History
| Date | Status | Borrower | Loan Amount |
|---|---|---|---|
| Open | Thompson Mary K | $250,000 | |
| Previous Owner | Thompson Mary K | $150,000 | |
| Previous Owner | Thompson Mary K | $110,000 | |
| Previous Owner | Thompson Mary K | $110,000 |
Source: Public Records
Tax History Compared to Growth
Tax History
| Year | Tax Paid | Tax Assessment Tax Assessment Total Assessment is a certain percentage of the fair market value that is determined by local assessors to be the total taxable value of land and additions on the property. | Land | Improvement |
|---|---|---|---|---|
| 2025 | $5,054 | $855,100 | $206,600 | $648,500 |
| 2024 | $4,866 | $807,000 | $194,900 | $612,100 |
| 2023 | $4,648 | $700,000 | $177,200 | $522,800 |
| 2022 | $4,443 | $547,900 | $154,100 | $393,800 |
| 2021 | $4,438 | $516,000 | $140,100 | $375,900 |
| 2020 | $4,216 | $482,900 | $137,100 | $345,800 |
| 2019 | $4,043 | $466,300 | $131,800 | $334,500 |
| 2018 | $4,058 | $447,700 | $119,800 | $327,900 |
| 2017 | $3,880 | $432,600 | $109,200 | $323,400 |
| 2016 | $3,798 | $418,700 | $109,200 | $309,500 |
| 2015 | $3,774 | $420,700 | $107,000 | $313,700 |
| 2014 | $3,532 | $402,700 | $94,400 | $308,300 |
Source: Public Records
Map
Nearby Homes