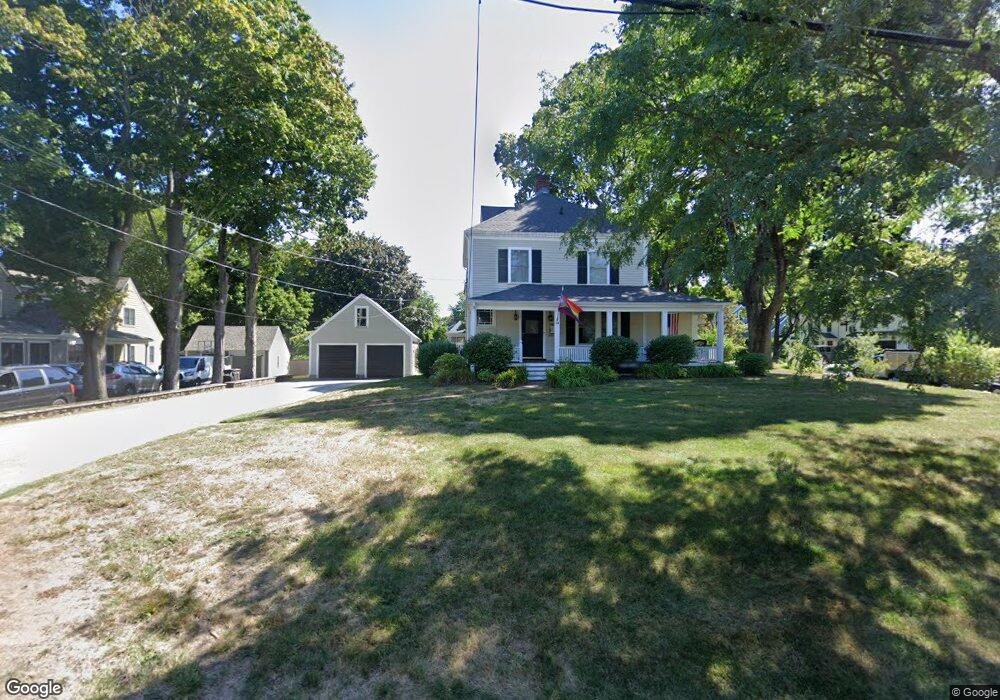
14 Union St Hingham, MA 02043
Estimated Value: $1,088,000 - $1,561,000
3
Beds
2
Baths
1,858
Sq Ft
$701/Sq Ft
Est. Value
About This Home
This home is located at 14 Union St, Hingham, MA 02043 and is currently estimated at $1,301,565, approximately $700 per square foot. 14 Union St is a home located in Plymouth County with nearby schools including East Elementary School, Hingham Middle School, and Hingham High School.
Ownership History
Date
Name
Owned For
Owner Type
Purchase Details
Closed on
May 31, 1994
Sold by
Maeve Bldg Corp
Bought by
Heissner Russell F and Heissner Mary M
Current Estimated Value
Purchase Details
Closed on
Jun 7, 1991
Sold by
Hoye William J and Hoye Joan N
Bought by
Murphy Martin G
Create a Home Valuation Report for This Property
The Home Valuation Report is an in-depth analysis detailing your home's value as well as a comparison with similar homes in the area
Purchase History
| Date | Buyer | Sale Price | Title Company |
|---|---|---|---|
| Heissner Russell F | $250,500 | -- | |
| Murphy Martin G | $200,000 | -- | |
| Heissner Russell F | $250,500 | -- | |
| Murphy Martin G | $200,000 | -- |
Source: Public Records
Mortgage History
| Date | Status | Borrower | Loan Amount |
|---|---|---|---|
| Open | Murphy Martin G | $436,000 | |
| Closed | Murphy Martin G | $500,000 |
Source: Public Records
Tax History Compared to Growth
Tax History
| Year | Tax Paid | Tax Assessment Tax Assessment Total Assessment is a certain percentage of the fair market value that is determined by local assessors to be the total taxable value of land and additions on the property. | Land | Improvement |
|---|---|---|---|---|
| 2025 | $11,452 | $1,071,300 | $564,600 | $506,700 |
| 2024 | $10,508 | $968,500 | $564,600 | $403,900 |
| 2023 | $9,498 | $949,800 | $564,600 | $385,200 |
| 2022 | $10,345 | $894,900 | $509,700 | $385,200 |
| 2021 | $9,806 | $831,000 | $490,100 | $340,900 |
| 2020 | $9,581 | $831,000 | $490,100 | $340,900 |
| 2019 | $9,565 | $809,900 | $490,100 | $319,800 |
| 2018 | $9,395 | $798,200 | $490,100 | $308,100 |
| 2017 | $9,399 | $767,300 | $501,400 | $265,900 |
| 2016 | $9,233 | $739,200 | $477,600 | $261,600 |
| 2015 | $8,845 | $705,900 | $455,000 | $250,900 |
Source: Public Records
Map
Nearby Homes