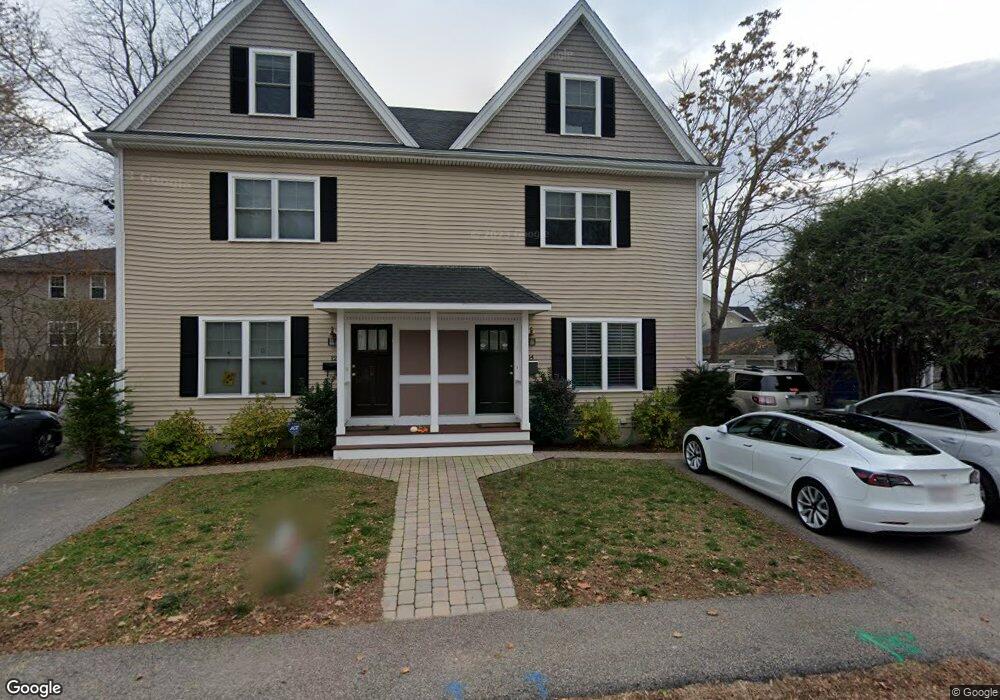
14 Union St Unit Right-side Needham, MA 02494
Estimated Value: $1,027,000 - $1,358,000
3
Beds
3
Baths
2,000
Sq Ft
$594/Sq Ft
Est. Value
About This Home
This home is located at 14 Union St Unit Right-side, Needham, MA 02494 and is currently estimated at $1,188,380, approximately $594 per square foot. 14 Union St Unit Right-side is a home located in Norfolk County with nearby schools including Sunita L. Williams Elementary School, High Rock Middle School, and Pollard Middle School.
Ownership History
Date
Name
Owned For
Owner Type
Purchase Details
Closed on
Mar 27, 2015
Sold by
Elzon Arthur and Elzon Valentina
Bought by
Braunstein Robert S and Braunstein Anne R
Current Estimated Value
Home Financials for this Owner
Home Financials are based on the most recent Mortgage that was taken out on this home.
Original Mortgage
$567,200
Outstanding Balance
$424,585
Interest Rate
3%
Mortgage Type
Purchase Money Mortgage
Estimated Equity
$763,795
Purchase Details
Closed on
Aug 16, 2012
Sold by
Hyland Eleanor C and Kniebel Jason A
Bought by
Elzon Arthur and Elzon Valentina
Home Financials for this Owner
Home Financials are based on the most recent Mortgage that was taken out on this home.
Original Mortgage
$465,600
Interest Rate
3%
Mortgage Type
Adjustable Rate Mortgage/ARM
Create a Home Valuation Report for This Property
The Home Valuation Report is an in-depth analysis detailing your home's value as well as a comparison with similar homes in the area
Home Values in the Area
Average Home Value in this Area
Purchase History
| Date | Buyer | Sale Price | Title Company |
|---|---|---|---|
| Braunstein Robert S | $709,000 | -- | |
| Elzon Arthur | $582,000 | -- |
Source: Public Records
Mortgage History
| Date | Status | Borrower | Loan Amount |
|---|---|---|---|
| Open | Braunstein Robert S | $567,200 | |
| Previous Owner | Elzon Arthur | $465,600 |
Source: Public Records
Tax History Compared to Growth
Tax History
| Year | Tax Paid | Tax Assessment Tax Assessment Total Assessment is a certain percentage of the fair market value that is determined by local assessors to be the total taxable value of land and additions on the property. | Land | Improvement |
|---|---|---|---|---|
| 2025 | $9,776 | $922,300 | $0 | $922,300 |
| 2024 | $9,480 | $757,200 | $0 | $757,200 |
| 2023 | $9,586 | $735,100 | $0 | $735,100 |
| 2022 | $9,264 | $692,900 | $0 | $692,900 |
| 2021 | $9,028 | $692,900 | $0 | $692,900 |
| 2020 | $8,482 | $679,100 | $0 | $679,100 |
| 2019 | $8,242 | $665,200 | $0 | $665,200 |
| 2018 | $7,669 | $645,500 | $0 | $645,500 |
| 2017 | $7,535 | $633,700 | $0 | $633,700 |
| 2016 | $7,313 | $633,700 | $0 | $633,700 |
| 2015 | $6,574 | $582,300 | $0 | $582,300 |
| 2014 | $6,457 | $554,700 | $0 | $554,700 |
Source: Public Records
Map
Nearby Homes
- 403 Hunnewell St Unit 403
- 379 Hunnewell St Unit 379
- 381 Hunnewell St Unit 381
- 400 Hunnewell St Unit 103
- 132 Hillside Ave
- 609 Hunnewell St
- 28 Mercer Rd
- 35 Andrea Cir
- 7 Avery St
- 34 Pershing Rd
- 263 Hunnewell St
- 77 High St
- 36 Davenport Rd
- 27 Concord St
- 547 Webster St
- 556 Webster St
- 39 Donna Rd
- 14 Lasalle Rd
- 28 Woodbine Cir
- 443 Central Ave
- 14 Union St
- 12 Union St Unit Left-side
- 12 Union St
- 18 Union St
- 283 Hillside Ave
- 283 Hillside Ave Unit 283
- 283 Hillside Ave Unit 1
- 7 Union St
- 7 Union St Unit 1
- 13 Union St
- 15 Union St
- 15 Union St Unit 2
- 23 Crescent Rd
- 23 Crescent Rd Unit 2
- 299 Hillside Ave
- 297 Hillside Ave
- 21 Crescent Rd
- 21 Crescent Rd Unit 21
- 21 Crescent Rd Unit 1
- 19 Union St Unit 1