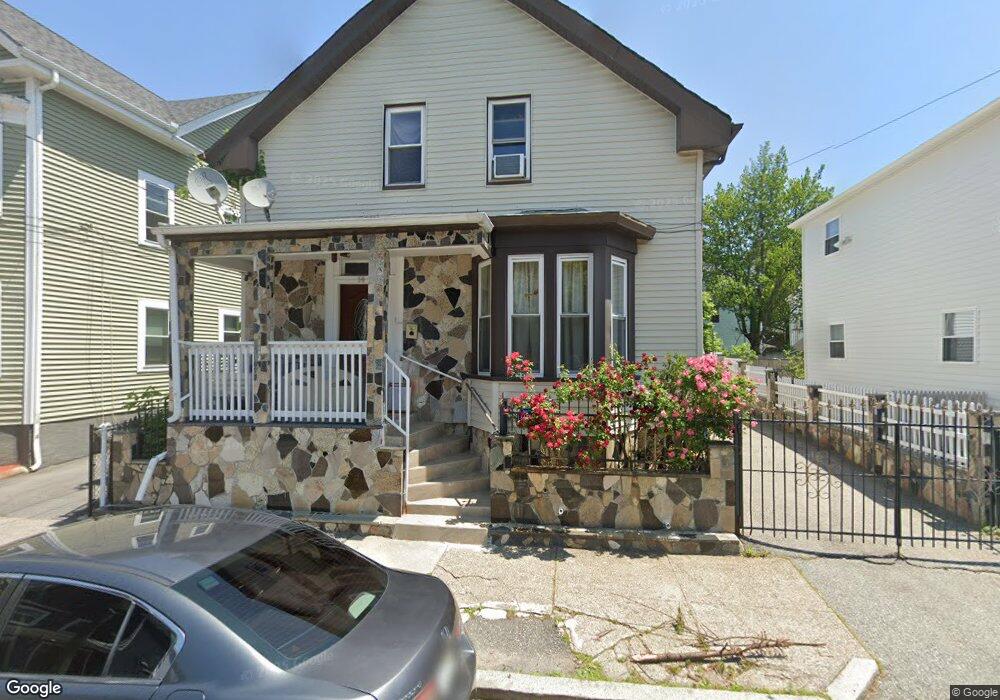
14 Van Buren St Providence, RI 02905
Lower South Providence NeighborhoodEstimated Value: $364,000 - $410,000
4
Beds
2
Baths
1,275
Sq Ft
$304/Sq Ft
Est. Value
About This Home
This home is located at 14 Van Buren St, Providence, RI 02905 and is currently estimated at $387,853, approximately $304 per square foot. 14 Van Buren St is a home located in Providence County with nearby schools including Asa Messer Elementary School, Charles N. Fortes Elementary School, and Robert L. Bailey IV Elementary.
Ownership History
Date
Name
Owned For
Owner Type
Purchase Details
Closed on
Jan 19, 2010
Sold by
Garcia Casiano and Depena Nairoby
Bought by
Garcia Casiano and Garcina Marina
Current Estimated Value
Home Financials for this Owner
Home Financials are based on the most recent Mortgage that was taken out on this home.
Original Mortgage
$176,168
Interest Rate
5.01%
Purchase Details
Closed on
Nov 19, 1999
Sold by
Ocwen Fed Saving Bank
Bought by
Garica Casiano and Garica Evaristo
Create a Home Valuation Report for This Property
The Home Valuation Report is an in-depth analysis detailing your home's value as well as a comparison with similar homes in the area
Home Values in the Area
Average Home Value in this Area
Purchase History
| Date | Buyer | Sale Price | Title Company |
|---|---|---|---|
| Garcia Casiano | -- | -- | |
| Garica Casiano | $26,000 | -- |
Source: Public Records
Mortgage History
| Date | Status | Borrower | Loan Amount |
|---|---|---|---|
| Previous Owner | Garica Casiano | $176,168 | |
| Previous Owner | Garica Casiano | $103,900 | |
| Previous Owner | Garica Casiano | $75,000 | |
| Previous Owner | Garica Casiano | $35,000 |
Source: Public Records
Tax History Compared to Growth
Tax History
| Year | Tax Paid | Tax Assessment Tax Assessment Total Assessment is a certain percentage of the fair market value that is determined by local assessors to be the total taxable value of land and additions on the property. | Land | Improvement |
|---|---|---|---|---|
| 2025 | $2,834 | $337,400 | $118,800 | $218,600 |
| 2024 | $4,466 | $243,400 | $75,200 | $168,200 |
| 2023 | $4,466 | $243,400 | $75,200 | $168,200 |
| 2022 | $4,333 | $243,400 | $75,200 | $168,200 |
| 2021 | $3,736 | $152,100 | $33,200 | $118,900 |
| 2020 | $3,736 | $152,100 | $33,200 | $118,900 |
| 2019 | $3,736 | $152,100 | $33,200 | $118,900 |
| 2018 | $4,011 | $125,500 | $30,200 | $95,300 |
| 2017 | $4,011 | $125,500 | $30,200 | $95,300 |
| 2016 | $4,011 | $125,500 | $30,200 | $95,300 |
| 2015 | $4,028 | $121,700 | $30,200 | $91,500 |
| 2014 | $4,107 | $121,700 | $30,200 | $91,500 |
| 2013 | $4,107 | $121,700 | $30,200 | $91,500 |
Source: Public Records
Map
Nearby Homes
- 17 Plum St
- 143 Houston St
- 136 Houston St
- 199 Gallup St
- 226 Oxford St
- 8 Atlantic Ave
- 33 Adelaide Ave
- 40 Gladstone St
- 104 Miner St
- 176 Reynolds Ave
- 186 Oxford St
- 171 Reynolds Ave
- 76 Adelaide Ave
- 462 Prairie Ave
- 20 Pennsylvania Ave
- 164 Oxford St
- 42 Burnside St
- 307 Sayles St
- 6 Warrington St
- 154 Oxford St