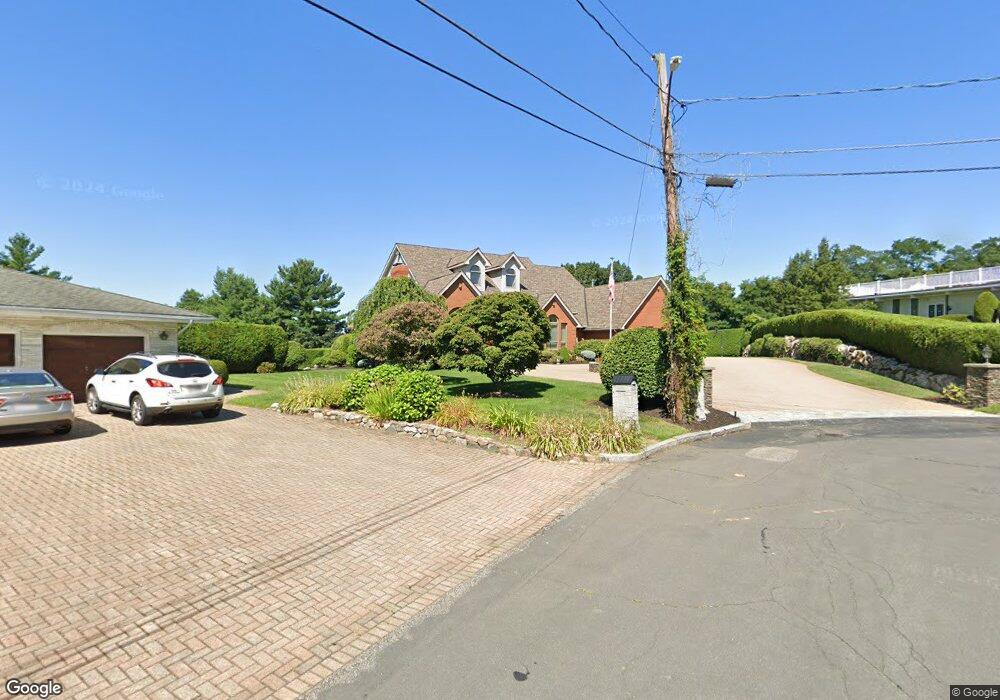
14 Vinson Cir Winchester, MA 01890
West Side NeighborhoodEstimated Value: $2,672,952 - $3,692,000
4
Beds
5
Baths
7,390
Sq Ft
$414/Sq Ft
Est. Value
About This Home
This home is located at 14 Vinson Cir, Winchester, MA 01890 and is currently estimated at $3,062,238, approximately $414 per square foot. 14 Vinson Cir is a home located in Middlesex County with nearby schools including Vinson-Owen Elementary School, McCall Middle School, and Winchester High School.
Ownership History
Date
Name
Owned For
Owner Type
Purchase Details
Closed on
Sep 26, 2006
Sold by
Dauria Dawn M
Bought by
14 Vinson Circle Rt
Current Estimated Value
Purchase Details
Closed on
Nov 1, 1996
Sold by
Piantedosi Joann
Bought by
Dauria Dawn
Create a Home Valuation Report for This Property
The Home Valuation Report is an in-depth analysis detailing your home's value as well as a comparison with similar homes in the area
Home Values in the Area
Average Home Value in this Area
Purchase History
| Date | Buyer | Sale Price | Title Company |
|---|---|---|---|
| 14 Vinson Circle Rt | -- | -- | |
| Dauria Dawn | $775,000 | -- |
Source: Public Records
Mortgage History
| Date | Status | Borrower | Loan Amount |
|---|---|---|---|
| Open | Dauria Dawn | $100,000 | |
| Previous Owner | Dauria Dawn | $697,000 |
Source: Public Records
Tax History Compared to Growth
Tax History
| Year | Tax Paid | Tax Assessment Tax Assessment Total Assessment is a certain percentage of the fair market value that is determined by local assessors to be the total taxable value of land and additions on the property. | Land | Improvement |
|---|---|---|---|---|
| 2025 | $255 | $2,295,900 | $909,200 | $1,386,700 |
| 2024 | $24,055 | $2,123,100 | $837,200 | $1,285,900 |
| 2023 | $23,150 | $1,961,900 | $693,200 | $1,268,700 |
| 2022 | $23,463 | $1,875,500 | $638,400 | $1,237,100 |
| 2021 | $22,908 | $1,785,500 | $548,400 | $1,237,100 |
| 2020 | $22,122 | $1,785,500 | $548,400 | $1,237,100 |
| 2019 | $21,186 | $1,749,500 | $512,400 | $1,237,100 |
| 2018 | $20,423 | $1,675,400 | $471,900 | $1,203,500 |
| 2017 | $20,043 | $1,632,200 | $471,900 | $1,160,300 |
| 2016 | $18,663 | $1,597,900 | $471,900 | $1,126,000 |
| 2015 | $18,177 | $1,497,300 | $412,500 | $1,084,800 |
| 2014 | $18,644 | $1,472,700 | $395,400 | $1,077,300 |
Source: Public Records
Map
Nearby Homes
- 7 Thornberry Rd
- 41 Squire Rd
- 26 Berkshire Dr
- 20 Amberwood Dr
- 19 Cox Rd
- 14 Nassau Dr
- 5 Azalea Rd
- 257 High St
- 19 Gershon Way Unit 1
- 19 Gershon Way
- 276 High St
- 189 High St
- 7 Grace Rd
- 16 Winning Farm Rd Unit 16
- 21 Derby Dr Unit 21
- 30 Whipple Rd
- 139 High St
- 22 Tyler Rd
- 500 Lexington St Unit 6
- 8 Blueberry Ln