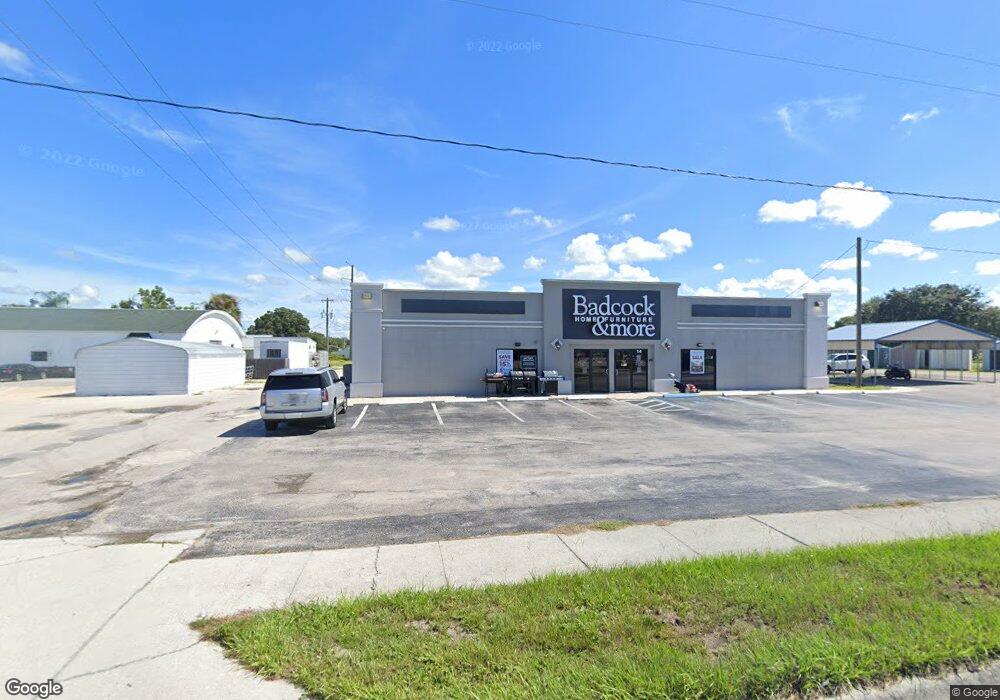
14 W Hickory St Arcadia, FL 34266
Estimated Value: $2,292,535
Studio
--
Bath
15,555
Sq Ft
$147/Sq Ft
Est. Value
About This Home
This home is located at 14 W Hickory St, Arcadia, FL 34266 and is currently estimated at $2,292,535, approximately $147 per square foot. 14 W Hickory St is a home located in DeSoto County with nearby schools including West Elementary School, DeSoto Middle School, and DeSoto County High School.
Ownership History
Date
Name
Owned For
Owner Type
Purchase Details
Closed on
Apr 20, 2020
Sold by
Ctf Investments Llc
Bought by
Boyke & Boyle Llc
Current Estimated Value
Home Financials for this Owner
Home Financials are based on the most recent Mortgage that was taken out on this home.
Original Mortgage
$1,040,000
Outstanding Balance
$919,564
Interest Rate
3.3%
Mortgage Type
Future Advance Clause Open End Mortgage
Estimated Equity
$1,372,971
Purchase Details
Closed on
Jan 9, 2015
Sold by
Frazier Clayton W and Frazier Tammie C
Bought by
Ctf Investments Llc
Purchase Details
Closed on
Feb 21, 2001
Sold by
Wells Fargo Home Mtg Inc
Bought by
Housing & Urban Dev
Purchase Details
Closed on
Jan 22, 2001
Sold by
Clerk Circuit Court Desoto Cty
Bought by
Crossland Mtg Corp
Purchase Details
Closed on
Sep 7, 2000
Sold by
Standard Fed Bk
Bought by
Housing & Urban Dev
Purchase Details
Closed on
Mar 24, 2000
Sold by
Clerk Circuit Court
Bought by
Standard Fed Bk
Create a Home Valuation Report for This Property
The Home Valuation Report is an in-depth analysis detailing your home's value as well as a comparison with similar homes in the area
Home Values in the Area
Average Home Value in this Area
Purchase History
| Date | Buyer | Sale Price | Title Company |
|---|---|---|---|
| Boyke & Boyle Llc | $1,300,000 | Attorney | |
| Ctf Investments Llc | -- | None Available | |
| Housing & Urban Dev | -- | -- | |
| Crossland Mtg Corp | -- | -- | |
| Housing & Urban Dev | -- | -- | |
| Standard Fed Bk | -- | -- |
Source: Public Records
Mortgage History
| Date | Status | Borrower | Loan Amount |
|---|---|---|---|
| Open | Boyke & Boyle Llc | $1,040,000 |
Source: Public Records
Map
Nearby Homes
- 103 N Brevard Ave
- 117 N Brevard Ave
- 214 W Whidden St
- 27 S Manatee Ave
- 89 W Imogene St
- 404 W Whidden St
- 146 N Hernando Ave
- 510 W Oak St
- 0 S Hillsborough Ave
- 609 N Orange Ave
- 3 W Myrtle St
- 245 S Brevard Ave
- 606 E Oak St
- 607 E Oak St
- 603 N Lee Ave
- 133 S Sumter Ave
- 114 Singleton Ave
- 918 W Magnolia St
- 20 Watson Ave
- 920 W Magnolia St
- 114 N Polk Ave
- 00 W Hickory St
- 122 N Polk Ave
- 124 N Polk Ave
- 139 N Desoto Ave
- 4453 Florida 70
- 2885 Florida 70
- 000 Florida 70
- 0000 Florida 70
- 3775 Florida 70
- 134 N Polk Ave
- 22 N Polk Ave
- 140 N Polk Ave
- 136 N Desoto Ave
- 127 N Polk Ave
- 14 N Polk Ave
- 10/12/14 N Desoto Ave
- 133 N Polk Ave
- 12 W Oak St
- 0 N Desoto Ave Unit F1002214
Your Personal Tour Guide
Ask me questions while you tour the home.