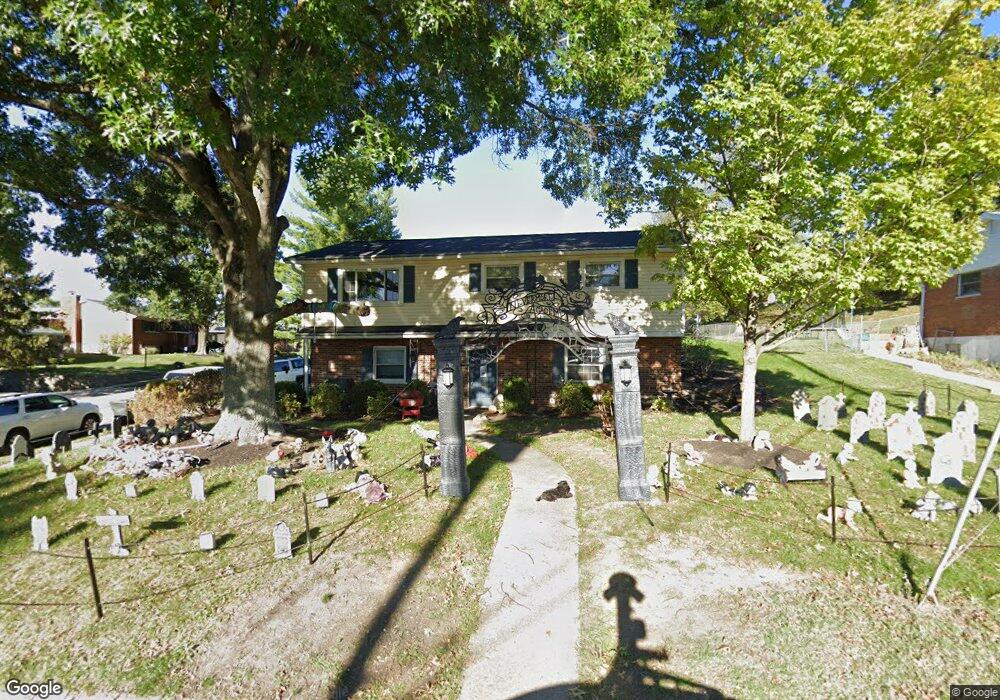
14 W Kimberly Dr Fort Thomas, KY 41075
Estimated Value: $321,234 - $365,000
4
Beds
2
Baths
1,560
Sq Ft
$222/Sq Ft
Est. Value
About This Home
This home is located at 14 W Kimberly Dr, Fort Thomas, KY 41075 and is currently estimated at $346,309, approximately $221 per square foot. 14 W Kimberly Dr is a home located in Campbell County with nearby schools including Highlands Middle School, Highlands High School, and St. Catherine of Siena School.
Ownership History
Date
Name
Owned For
Owner Type
Purchase Details
Closed on
Mar 30, 2012
Sold by
Citifinancial Inc
Bought by
Houze William
Current Estimated Value
Home Financials for this Owner
Home Financials are based on the most recent Mortgage that was taken out on this home.
Original Mortgage
$140,349
Outstanding Balance
$96,206
Interest Rate
3.75%
Mortgage Type
FHA
Estimated Equity
$250,103
Purchase Details
Closed on
Nov 15, 2011
Sold by
Huff Brian C
Bought by
Citifinancial Inc
Purchase Details
Closed on
Jul 27, 2007
Sold by
Thomas Carrie A and Huff Carrie A
Bought by
Huff Carrie A and Huff Brian C
Purchase Details
Closed on
Sep 30, 1998
Sold by
Ruebusch Nicholas A
Bought by
Thomas Gregory and Thomas Carrie
Home Financials for this Owner
Home Financials are based on the most recent Mortgage that was taken out on this home.
Original Mortgage
$106,400
Interest Rate
8.25%
Mortgage Type
New Conventional
Create a Home Valuation Report for This Property
The Home Valuation Report is an in-depth analysis detailing your home's value as well as a comparison with similar homes in the area
Home Values in the Area
Average Home Value in this Area
Purchase History
| Date | Buyer | Sale Price | Title Company |
|---|---|---|---|
| Houze William | $144,000 | Freibert Title Group Llc | |
| Citifinancial Inc | $90,000 | None Available | |
| Huff Carrie A | -- | Prominent Title Agency Llc | |
| Thomas Gregory | $112,000 | -- |
Source: Public Records
Mortgage History
| Date | Status | Borrower | Loan Amount |
|---|---|---|---|
| Open | Houze William | $140,349 | |
| Previous Owner | Thomas Gregory | $106,400 |
Source: Public Records
Tax History Compared to Growth
Tax History
| Year | Tax Paid | Tax Assessment Tax Assessment Total Assessment is a certain percentage of the fair market value that is determined by local assessors to be the total taxable value of land and additions on the property. | Land | Improvement |
|---|---|---|---|---|
| 2024 | $760 | $197,400 | $60,000 | $137,400 |
| 2023 | $780 | $197,400 | $60,000 | $137,400 |
| 2022 | $853 | $197,400 | $60,000 | $137,400 |
| 2021 | $759 | $168,500 | $45,000 | $123,500 |
| 2020 | $773 | $168,500 | $45,000 | $123,500 |
| 2019 | $779 | $168,500 | $45,000 | $123,500 |
| 2018 | $768 | $168,500 | $45,000 | $123,500 |
| 2017 | $669 | $144,000 | $45,000 | $99,000 |
| 2016 | $637 | $144,000 | $0 | $0 |
| 2015 | $648 | $144,000 | $0 | $0 |
| 2014 | $635 | $144,000 | $0 | $0 |
Source: Public Records
Map
Nearby Homes
- 42 E Kimberly Dr
- 57 E Kimberly Dr
- 72 Scenic View Dr
- 853 Lincoln Rd
- 53 Marian Dr
- 17 Harrison Ave
- 861 Belle Ridge Loop
- 140 Clover Ridge Ave
- 877 Belle Ridge Loop
- 192 Clover Ridge Ave
- 1625 N Fort Thomas Ave
- 38 Walker Rd
- 114 Wessex Place
- 109 Rosemont Ave
- 18 Tower Hill Rd
- 220 Bellepointe Commons
- 593 Water Works Rd
- 0 Memorial Pkwy Unit Lot 153/154 633472
- 24 Observatory Ave
- 422 Riverpointe Dr Unit 5
- 10 W Kimberly Dr
- 12 E Kimberly Dr
- 6 W Kimberly Dr
- 16 E Kimberly Dr
- 11 E Kimberly Dr
- 3 E Kimberly Dr
- 17 W Kimberly Dr
- 15 E Kimberly Dr
- 473 Rossford Ave
- 21 W Kimberly Dr
- 22 E Kimberly Dr
- 9 Brittany Ln
- 24 W Kimberly Dr
- 479 Rossford Ave
- 6 Brittany Ln
- 5 Brittany Ln Unit 5
- 28 E Kimberly Dr
- 27 W Kimberly Dr
- 458 Rossford Ave
- 483 Rossford Ave