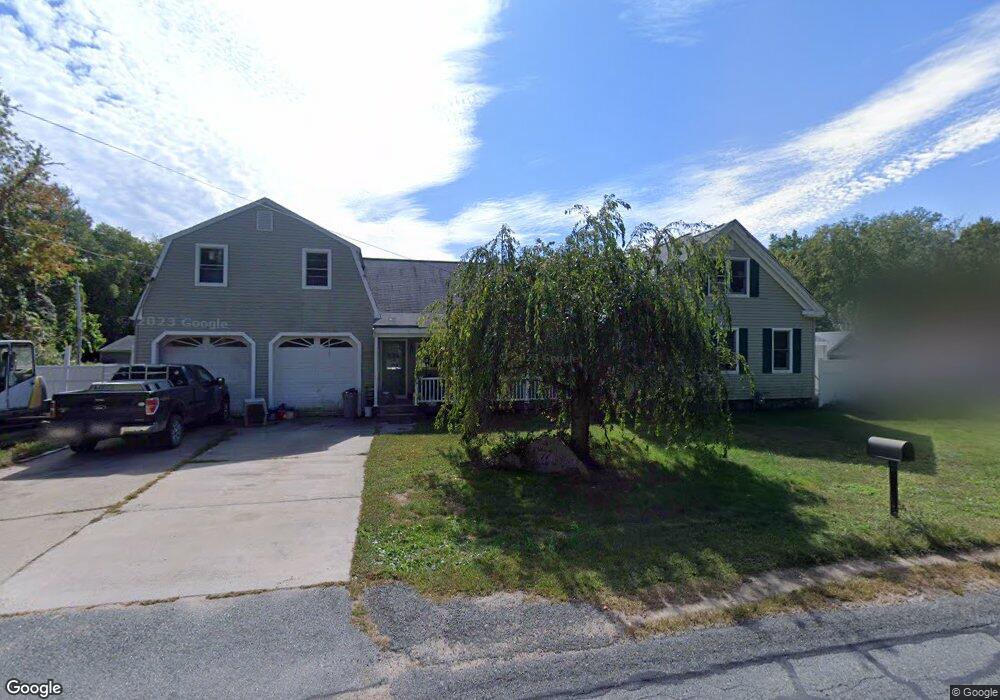
14 Walnut St Middleboro, MA 02346
Estimated Value: $542,745 - $713,000
3
Beds
1
Bath
2,750
Sq Ft
$232/Sq Ft
Est. Value
About This Home
This home is located at 14 Walnut St, Middleboro, MA 02346 and is currently estimated at $636,686, approximately $231 per square foot. 14 Walnut St is a home located in Plymouth County with nearby schools including Mary K. Goode Elementary School and Samuel Fuller School.
Ownership History
Date
Name
Owned For
Owner Type
Purchase Details
Closed on
May 10, 2021
Sold by
Shaw David L and Shaw Corrie A
Bought by
Butler Adam J and Edes Abigail J
Current Estimated Value
Home Financials for this Owner
Home Financials are based on the most recent Mortgage that was taken out on this home.
Original Mortgage
$392,656
Outstanding Balance
$355,844
Interest Rate
3.1%
Mortgage Type
FHA
Estimated Equity
$280,842
Purchase Details
Closed on
Mar 13, 2009
Sold by
Shaw David L
Bought by
Shaw David L and Shaw Corrie A
Purchase Details
Closed on
Jul 3, 1990
Sold by
Shaw David L
Bought by
Shaw David L
Home Financials for this Owner
Home Financials are based on the most recent Mortgage that was taken out on this home.
Original Mortgage
$90,000
Interest Rate
10.27%
Mortgage Type
Purchase Money Mortgage
Create a Home Valuation Report for This Property
The Home Valuation Report is an in-depth analysis detailing your home's value as well as a comparison with similar homes in the area
Home Values in the Area
Average Home Value in this Area
Purchase History
| Date | Buyer | Sale Price | Title Company |
|---|---|---|---|
| Butler Adam J | $399,900 | None Available | |
| Shaw David L | -- | -- | |
| Shaw David L | $120,000 | -- |
Source: Public Records
Mortgage History
| Date | Status | Borrower | Loan Amount |
|---|---|---|---|
| Open | Butler Adam J | $392,656 | |
| Previous Owner | Shaw David L | $45,000 | |
| Previous Owner | Shaw David L | $91,800 | |
| Previous Owner | Shaw David L | $90,000 |
Source: Public Records
Tax History Compared to Growth
Tax History
| Year | Tax Paid | Tax Assessment Tax Assessment Total Assessment is a certain percentage of the fair market value that is determined by local assessors to be the total taxable value of land and additions on the property. | Land | Improvement |
|---|---|---|---|---|
| 2025 | $6,516 | $485,900 | $158,700 | $327,200 |
| 2024 | $5,951 | $439,500 | $151,100 | $288,400 |
| 2023 | $5,539 | $389,000 | $151,100 | $237,900 |
| 2022 | $5,501 | $357,700 | $131,400 | $226,300 |
| 2021 | $5,104 | $313,700 | $115,300 | $198,400 |
| 2020 | $5,086 | $320,300 | $115,300 | $205,000 |
| 2019 | $4,906 | $316,900 | $115,300 | $201,600 |
| 2018 | $4,435 | $284,300 | $109,500 | $174,800 |
| 2017 | $4,185 | $265,400 | $105,400 | $160,000 |
| 2016 | $3,650 | $229,300 | $96,600 | $132,700 |
| 2015 | $3,995 | $253,200 | $96,600 | $156,600 |
Source: Public Records
Map
Nearby Homes
- 146 Miller St
- 167 Old Miller St
- Rear Wareham St
- 480 Wareham St
- 441 Wareham St
- 386 Wareham St
- 425 Wareham St
- 14 Pineridge Way Unit 14
- 14 Pineridge Way
- 37 Rocky Gutter St
- 124 Ashley Ln Unit 12-4
- 28 Wareham St
- 30 Ridge Dr
- 38 John Perkins Way
- 558 Wareham St
- 3 Sarah Reed Hunt Way
- 571 Wareham St
- 31 Sarah Reed Hunt Way
- 57 Long Point Rd Unit 210
- 4 Bella Path