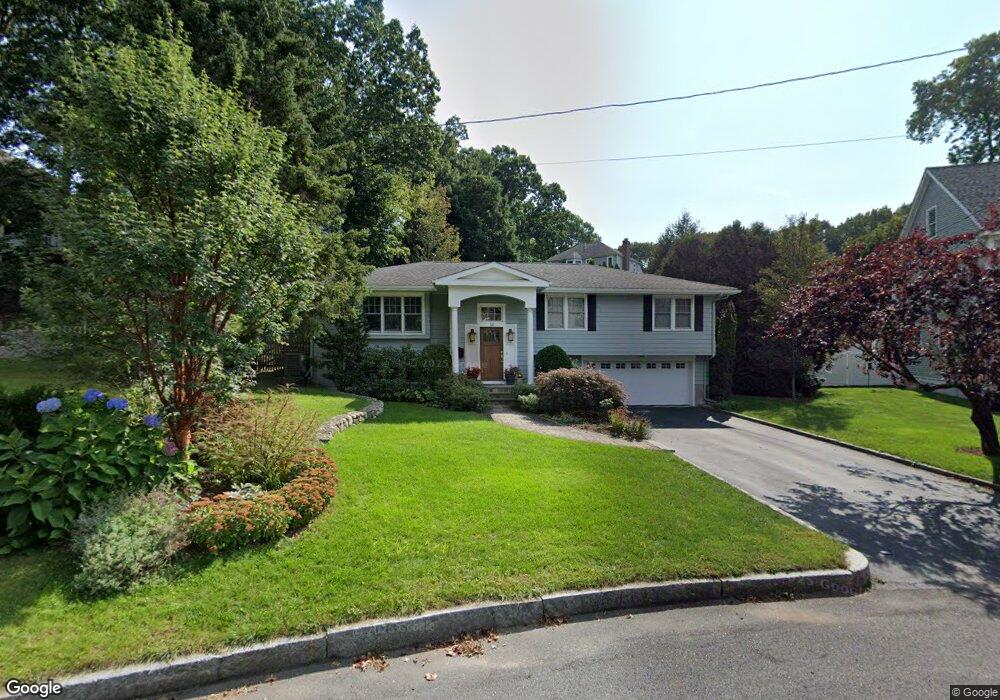
14 Wickham Rd Winchester, MA 01890
Grove Street NeighborhoodEstimated Value: $1,510,000 - $2,178,000
3
Beds
4
Baths
2,525
Sq Ft
$691/Sq Ft
Est. Value
About This Home
This home is located at 14 Wickham Rd, Winchester, MA 01890 and is currently estimated at $1,743,819, approximately $690 per square foot. 14 Wickham Rd is a home located in Middlesex County with nearby schools including Ambrose Elementary School, McCall Middle School, and Winchester High School.
Ownership History
Date
Name
Owned For
Owner Type
Purchase Details
Closed on
Oct 28, 2020
Sold by
Shank Eric and Johnson Deborah
Bought by
Johnson Deborah
Current Estimated Value
Purchase Details
Closed on
Nov 19, 1993
Sold by
Jaquier Hugues and Jaquier Chu Yuk Wah
Bought by
Johnson Deborah A and Shank Erik S
Home Financials for this Owner
Home Financials are based on the most recent Mortgage that was taken out on this home.
Original Mortgage
$309,600
Interest Rate
6.77%
Mortgage Type
Purchase Money Mortgage
Purchase Details
Closed on
Aug 1, 1989
Sold by
Torlone Claude
Bought by
Jaquier Hughes
Home Financials for this Owner
Home Financials are based on the most recent Mortgage that was taken out on this home.
Original Mortgage
$268,000
Interest Rate
9.9%
Mortgage Type
Purchase Money Mortgage
Create a Home Valuation Report for This Property
The Home Valuation Report is an in-depth analysis detailing your home's value as well as a comparison with similar homes in the area
Home Values in the Area
Average Home Value in this Area
Purchase History
| Date | Buyer | Sale Price | Title Company |
|---|---|---|---|
| Johnson Deborah | -- | None Available | |
| Johnson Deborah A | $344,000 | -- | |
| Jaquier Hughes | $335,000 | -- |
Source: Public Records
Mortgage History
| Date | Status | Borrower | Loan Amount |
|---|---|---|---|
| Previous Owner | Jaquier Hughes | $250,000 | |
| Previous Owner | Jaquier Hughes | $309,600 | |
| Previous Owner | Jaquier Hughes | $268,000 |
Source: Public Records
Tax History
| Year | Tax Paid | Tax Assessment Tax Assessment Total Assessment is a certain percentage of the fair market value that is determined by local assessors to be the total taxable value of land and additions on the property. | Land | Improvement |
|---|---|---|---|---|
| 2025 | $151 | $1,359,700 | $835,500 | $524,200 |
| 2024 | $15,187 | $1,340,400 | $835,500 | $504,900 |
| 2023 | $14,106 | $1,195,400 | $735,200 | $460,200 |
| 2022 | $14,133 | $1,129,700 | $668,400 | $461,300 |
| 2021 | $7,270 | $1,062,900 | $601,600 | $461,300 |
| 2020 | $7,049 | $1,062,900 | $601,600 | $461,300 |
| 2019 | $12,062 | $996,000 | $534,700 | $461,300 |
| 2018 | $6,722 | $944,200 | $482,900 | $461,300 |
| 2017 | $10,277 | $836,900 | $415,200 | $421,700 |
| 2016 | $9,030 | $773,100 | $391,000 | $382,100 |
| 2015 | $9,097 | $749,300 | $391,000 | $358,300 |
| 2014 | $8,580 | $677,700 | $325,800 | $351,900 |
Source: Public Records
Map
Nearby Homes
- 61 Grove St
- 10 Edgehill Rd
- 1 Town Way
- 6 Marchant Rd
- 2 Priscilla Ln
- 19 Town Way
- 9 Lakeview Terrace
- 17 Cranston Rd
- 45 Bacon St
- 39 Town Way
- 53 Winford Way
- 2 Everett Ave
- 27 Everett Ave
- 4 Leslie Rd
- 14 Symmes St
- 25 Myopia Rd
- 545 Winthrop St Unit Lot 6
- 545 Winthrop St Unit Lot 8
- 545 Winthrop St Unit Lot 7
- 40 Century St
- 12 Wickham Rd
- 16 Wickham Rd
- 11 Briarwood Ln
- 13 Briarwood Ln
- 15 Wickham Rd
- 16 Sussex Rd
- 14 Sussex Rd
- 10 Wickham Rd
- 1 Hastings Rd Lot 217
- 12 Hastings Road Lot 223
- 9 Briarwood Ln
- 18 Sussex Rd
- 17 Wickham Rd
- 12 Sussex Rd
- 11 Wickham Rd
- 12 Briarwood Ln
- 10 Briarwood Ln
- 8 Wickham Rd
- 15 Sussex Rd
- 17 Sussex Rd
Your Personal Tour Guide
Ask me questions while you tour the home.