
Landlord's Agent in 2025
Hong Li
Dynasty Agency, LLC
(609) 651-0797
9 in this area
73 Total Sales
Estimated Value: $886,000 - $1,190,000
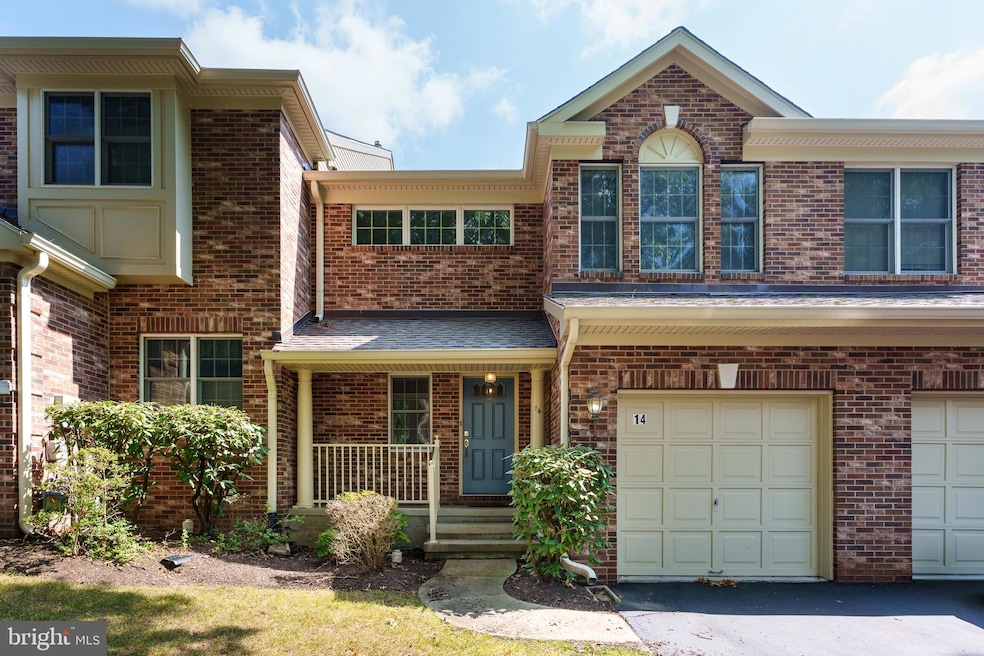
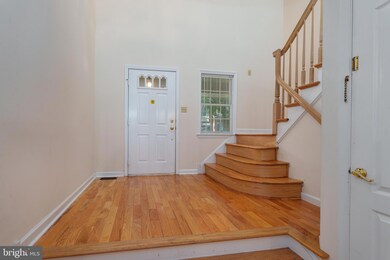
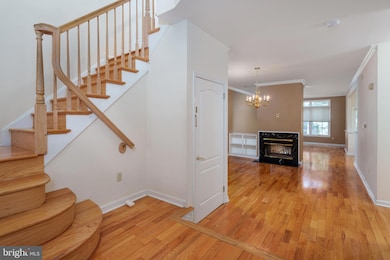
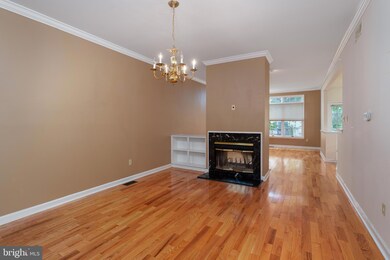
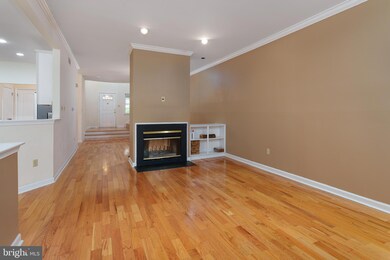
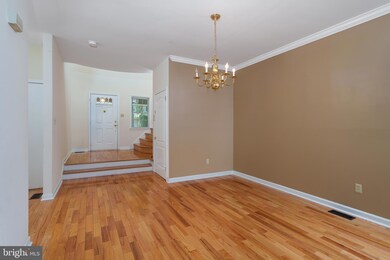
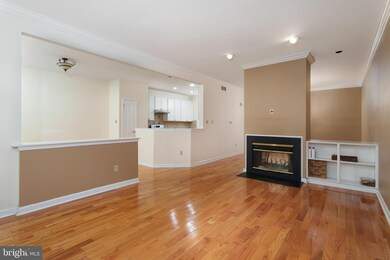
Sunny and lovely spectacular townhouse in Washington Oaks. The renovated kitchen with granite counter tops, open floor plan, hardwood floors throughout the whole house. Master bath has soaking tub and stall shower. Charming, double-sided fireplace for chilly evenings. Second floor laundry for convenience. Basement available for storage. Attached one car garage. Excellent condition. Great location, close to shopping mall, major roads, Princeton and the Princeton Junction train station
Last Agent to Rent the Property
(609) 651-0797 amy4homes@hotmail.com Dynasty Agency, LLC Listed on: 05/24/2025
Last Renter's Agent
(908) 227-9044 galina.peterson@foxroach.com BHHS Fox & Roach - Princeton License #1222472
| Date | Buyer | Sale Price | Title Company |
|---|---|---|---|
| Lu Kai | $530,000 | None Available | |
| West Susan | $330,500 | -- |
| Date | Status | Borrower | Loan Amount |
|---|---|---|---|
| Previous Owner | West Susan | $264,400 |
| Date | Event | Price | List to Sale | Price per Sq Ft | Prior Sale |
|---|---|---|---|---|---|
| 08/15/2025 08/15/25 | Rented | $4,500 | -4.3% | -- | |
| 06/22/2025 06/22/25 | Under Contract | -- | -- | -- | |
| 05/24/2025 05/24/25 | For Rent | $4,700 | +17.5% | -- | |
| 09/27/2021 09/27/21 | Rented | $4,000 | 0.0% | -- | |
| 07/13/2021 07/13/21 | For Rent | $4,000 | +1.3% | -- | |
| 09/15/2020 09/15/20 | Rented | $3,950 | 0.0% | -- | |
| 09/05/2020 09/05/20 | Under Contract | -- | -- | -- | |
| 08/05/2020 08/05/20 | For Rent | $3,950 | +23.4% | -- | |
| 05/01/2015 05/01/15 | Rented | $3,200 | 0.0% | -- | |
| 04/30/2015 04/30/15 | Under Contract | -- | -- | -- | |
| 04/25/2015 04/25/15 | For Rent | $3,200 | 0.0% | -- | |
| 03/27/2014 03/27/14 | Sold | $530,000 | +1.0% | -- | View Prior Sale |
| 03/25/2014 03/25/14 | Price Changed | $525,000 | 0.0% | -- | |
| 03/20/2014 03/20/14 | Pending | -- | -- | -- | |
| 03/15/2014 03/15/14 | Pending | -- | -- | -- | |
| 01/20/2014 01/20/14 | Price Changed | $525,000 | -4.5% | -- | |
| 12/13/2013 12/13/13 | Price Changed | $550,000 | -1.8% | -- | |
| 11/14/2013 11/14/13 | For Sale | $560,000 | -- | -- |
| Year | Tax Paid | Tax Assessment Tax Assessment Total Assessment is a certain percentage of the fair market value that is determined by local assessors to be the total taxable value of land and additions on the property. | Land | Improvement |
|---|---|---|---|---|
| 2025 | $14,383 | $540,100 | $317,500 | $222,600 |
| 2024 | $13,578 | $540,100 | $317,500 | $222,600 |
| 2023 | $13,578 | $540,100 | $317,500 | $222,600 |
| 2022 | $13,135 | $540,100 | $317,500 | $222,600 |
| 2021 | $13,173 | $540,100 | $317,500 | $222,600 |
| 2020 | $13,070 | $540,100 | $317,500 | $222,600 |
| 2019 | $12,811 | $540,100 | $317,500 | $222,600 |
| 2018 | $11,662 | $500,100 | $277,500 | $222,600 |
| 2017 | $11,502 | $500,100 | $277,500 | $222,600 |
| 2016 | $10,285 | $454,300 | $227,500 | $226,800 |
| 2015 | $10,049 | $454,300 | $227,500 | $226,800 |
| 2014 | $9,926 | $454,300 | $227,500 | $226,800 |
Landlord's Agent in 2025
Hong Li
Dynasty Agency, LLC
(609) 651-0797
9 in this area
73 Total Sales
Tenant's Agent in 2025
Galina Peterson
BHHS Fox & Roach
(908) 227-9044
18 in this area
30 Total Sales
I
Buyer Co-Listing Agent in 2025
Isabelle Delafosse
BHHS Fox & Roach
(609) 433-9297
2 Total Sales
Buyer's Agent in 2021
Helene Fazio
Coldwell Banker Residential Brokerage - Princeton
(609) 658-3277
6 in this area
63 Total Sales
Buyer's Agent in 2020
Nicole Muk
Queenston Realty, LLC
(609) 349-6391
3 in this area
59 Total Sales
Buyer's Agent in 2015
Judson Henderson
Callaway Henderson Sotheby's Int'l-Princeton
(609) 651-2226
78 in this area
114 Total Sales
Source: Bright MLS
MLS Number: NJME2060038
APN: 14-09702-0000-00030
Disclaimer: Certain information contained herein is derived from information provided by parties other than Homes.com. All information provided is deemed reliable, but is not guaranteed to be accurate and should be independently verified.
![]() The data relating to real estate for sale on this website appears in part through the BRIGHT Internet Data Exchange program, a voluntary cooperative exchange of property listing data between licensed real estate brokerage firms, and is provided by BRIGHT through a licensing agreement.
The data relating to real estate for sale on this website appears in part through the BRIGHT Internet Data Exchange program, a voluntary cooperative exchange of property listing data between licensed real estate brokerage firms, and is provided by BRIGHT through a licensing agreement.
Listing information is from various brokers who participate in the Bright MLS IDX program and not all listings may be visible on the site.
The property information being provided on or through the website is for the personal, non-commercial use of consumers and such information may not be used for any purpose other than to identify prospective properties consumers may be interested in purchasing.
Some properties which appear for sale on the website may no longer be available because they are for instance, under contract, sold or are no longer being offered for sale.
Property information displayed is deemed reliable but is not guaranteed.
Copyright 2025 Bright MLS, Inc.