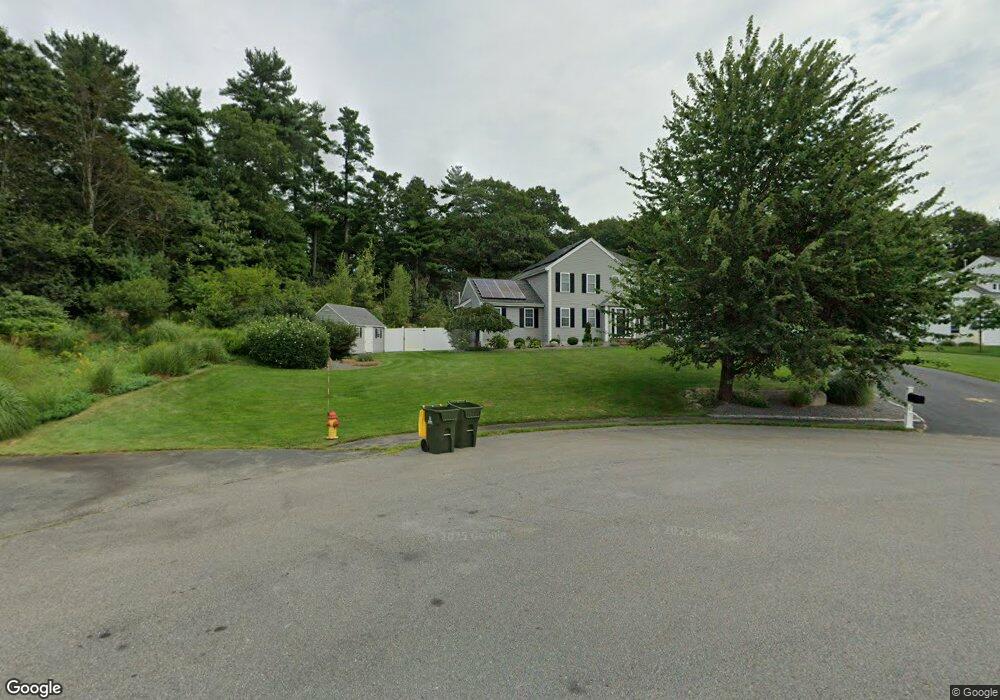
14 William Way Hanson, MA 02341
Estimated Value: $840,327 - $940,000
4
Beds
3
Baths
2,848
Sq Ft
$318/Sq Ft
Est. Value
About This Home
This home is located at 14 William Way, Hanson, MA 02341 and is currently estimated at $905,332, approximately $317 per square foot. 14 William Way is a home located in Plymouth County.
Ownership History
Date
Name
Owned For
Owner Type
Purchase Details
Closed on
Feb 23, 2006
Sold by
Cordwood Dev Llc and Gosselin Jeffrey D
Bought by
Obrien Francis X and Obrien Danielle K
Current Estimated Value
Create a Home Valuation Report for This Property
The Home Valuation Report is an in-depth analysis detailing your home's value as well as a comparison with similar homes in the area
Home Values in the Area
Average Home Value in this Area
Purchase History
| Date | Buyer | Sale Price | Title Company |
|---|---|---|---|
| Obrien Francis X | $557,850 | -- |
Source: Public Records
Mortgage History
| Date | Status | Borrower | Loan Amount |
|---|---|---|---|
| Open | Obrien Francis X | $80,000 | |
| Open | Obrien Francis X | $399,900 | |
| Closed | Obrien Francis X | $80,000 |
Source: Public Records
Tax History
| Year | Tax Paid | Tax Assessment Tax Assessment Total Assessment is a certain percentage of the fair market value that is determined by local assessors to be the total taxable value of land and additions on the property. | Land | Improvement |
|---|---|---|---|---|
| 2025 | $10,473 | $782,700 | $193,900 | $588,800 |
| 2024 | $10,260 | $766,800 | $188,300 | $578,500 |
| 2023 | $9,926 | $700,000 | $188,300 | $511,700 |
| 2022 | $9,689 | $642,100 | $171,200 | $470,900 |
| 2021 | $8,239 | $545,600 | $164,600 | $381,000 |
| 2020 | $8,118 | $531,600 | $159,000 | $372,600 |
| 2019 | $7,754 | $499,300 | $156,000 | $343,300 |
| 2018 | $7,663 | $484,100 | $150,000 | $334,100 |
| 2017 | $7,428 | $464,800 | $142,800 | $322,000 |
| 2016 | $7,519 | $454,300 | $142,800 | $311,500 |
| 2015 | $7,099 | $445,900 | $142,800 | $303,100 |
Source: Public Records
Map
Nearby Homes
- 339 State St
- 430 Brook Bend Rd
- 127 Crescent Place
- 26 Stonebridge Dr
- 139 Fairwood Dr
- 269 Lakeside Rd
- 108 Waterford Dr
- 134 Crescent St
- 161 Winter St Unit 11
- 51 Farmside Dr
- 114 Graham Hill Dr
- 84 Liberty St
- 7 Farmside Dr
- Lot 5 Princeton Way
- 285 W Elm St
- Lot 6 Way
- 60 Summer Path Way
- 66 Wildwood Rd
- 724 Whitman St
- 95 Tecumseh Dr
Your Personal Tour Guide
Ask me questions while you tour the home.