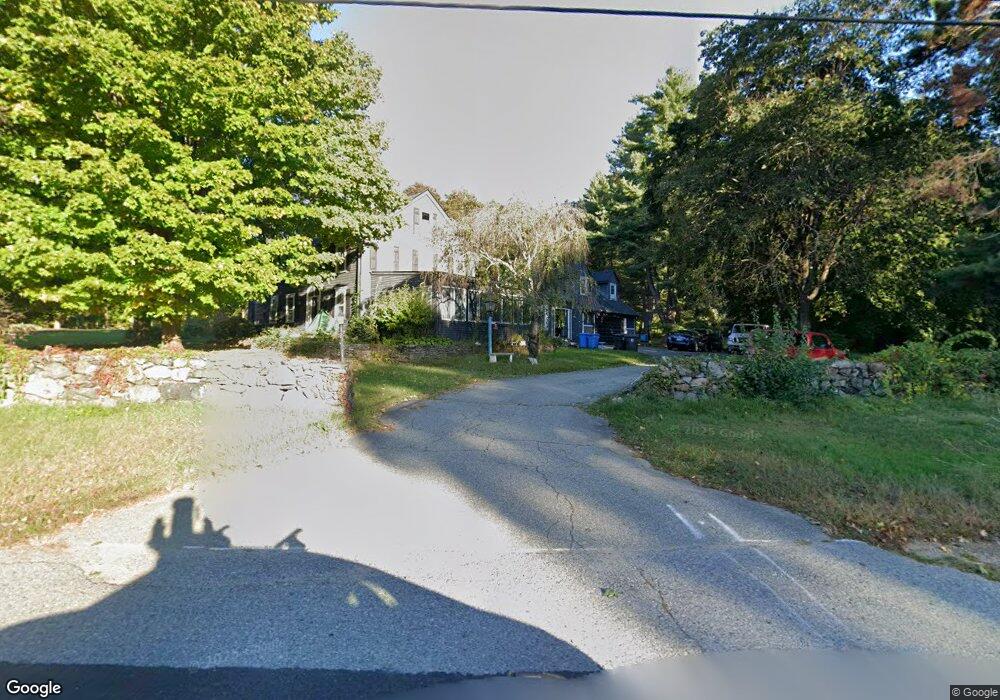
140 Angell Rd Cumberland, RI 02864
Ashton NeighborhoodEstimated Value: $711,000 - $1,188,000
4
Beds
4
Baths
3,464
Sq Ft
$270/Sq Ft
Est. Value
About This Home
This home is located at 140 Angell Rd, Cumberland, RI 02864 and is currently estimated at $936,934, approximately $270 per square foot. 140 Angell Rd is a home located in Providence County with nearby schools including Ashton Elementary School, Joseph L. McCourt Middle School, and Cumberland High School.
Ownership History
Date
Name
Owned For
Owner Type
Purchase Details
Closed on
Apr 29, 2016
Sold by
Virginia S Russo Ret
Bought by
Rodrigues Jason J and Rodrigues Kiley J
Current Estimated Value
Home Financials for this Owner
Home Financials are based on the most recent Mortgage that was taken out on this home.
Original Mortgage
$342,000
Interest Rate
3.73%
Mortgage Type
Purchase Money Mortgage
Create a Home Valuation Report for This Property
The Home Valuation Report is an in-depth analysis detailing your home's value as well as a comparison with similar homes in the area
Home Values in the Area
Average Home Value in this Area
Purchase History
| Date | Buyer | Sale Price | Title Company |
|---|---|---|---|
| Rodrigues Jason J | $342,000 | -- |
Source: Public Records
Mortgage History
| Date | Status | Borrower | Loan Amount |
|---|---|---|---|
| Open | Rodrigues Jason J | $33,000 | |
| Closed | Rodrigues Jason J | $342,000 | |
| Previous Owner | Rodrigues Jason J | $340,000 | |
| Previous Owner | Rodrigues Jason J | $75,000 |
Source: Public Records
Tax History
| Year | Tax Paid | Tax Assessment Tax Assessment Total Assessment is a certain percentage of the fair market value that is determined by local assessors to be the total taxable value of land and additions on the property. | Land | Improvement |
|---|---|---|---|---|
| 2025 | $8,839 | $720,400 | $176,700 | $543,700 |
| 2024 | $8,609 | $720,400 | $176,700 | $543,700 |
| 2023 | $8,371 | $720,400 | $176,700 | $543,700 |
| 2022 | $7,937 | $529,500 | $126,100 | $403,400 |
| 2021 | $7,805 | $529,500 | $126,100 | $403,400 |
| 2020 | $7,582 | $529,500 | $126,100 | $403,400 |
| 2019 | $7,392 | $465,500 | $107,300 | $358,200 |
| 2018 | $7,178 | $465,500 | $107,300 | $358,200 |
| 2017 | $7,080 | $465,500 | $107,300 | $358,200 |
| 2016 | $7,312 | $428,100 | $110,500 | $317,600 |
| 2015 | $7,312 | $428,100 | $110,500 | $317,600 |
| 2014 | $12,830 | $428,100 | $110,500 | $317,600 |
| 2013 | $6,954 | $440,700 | $112,000 | $328,700 |
Source: Public Records
Map
Nearby Homes
- 97 Angell Rd
- 140 Lippitt Ave
- 150 Leigh Rd
- 27 Oxford Rd
- 30 Bear Hill Rd
- 26 Country Hill Rd
- 15 Standring St
- 43 Massachusetts Ave
- 33 New York Ave
- 6 Wyoming Dr
- 1 Barway Ln
- 154 Bear Hill Rd Unit 401
- 85 Colonial Ave
- 137 Colonial Ave
- 16 Owen Dr
- 18 Narragansett Ave
- 1504 Hunting Hill Dr
- 1502 Hunting Hill Dr
- 1503 Hunting Hill Dr
- 1501 Hunting Hill Dr
Your Personal Tour Guide
Ask me questions while you tour the home.