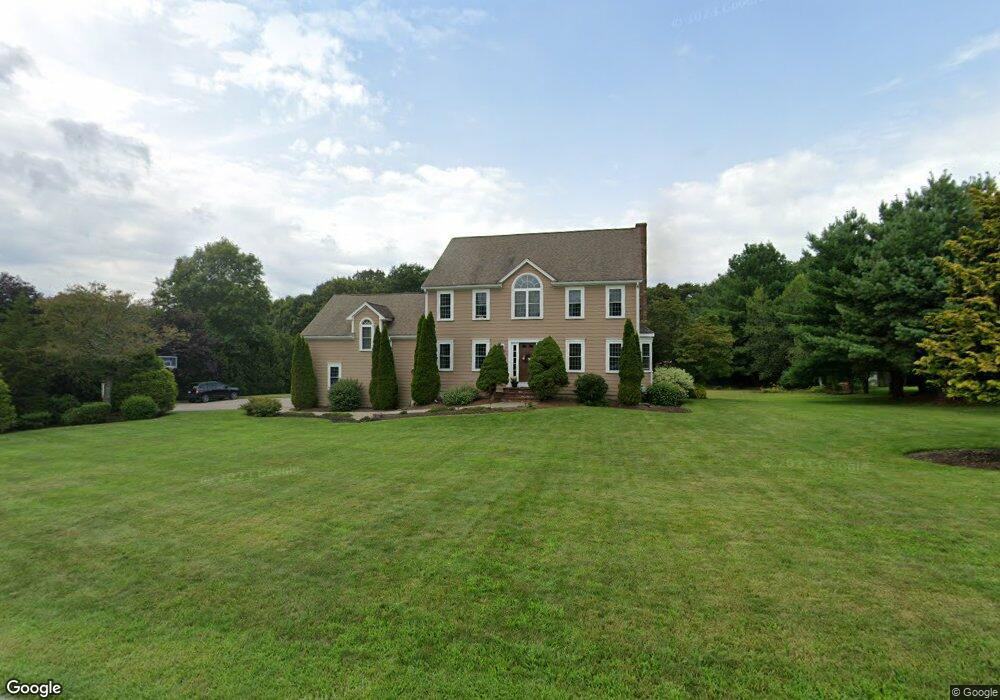
140 Autumn Rd Wrentham, MA 02093
West Wrentham NeighborhoodEstimated Value: $899,206 - $1,028,000
4
Beds
3
Baths
2,854
Sq Ft
$341/Sq Ft
Est. Value
About This Home
This home is located at 140 Autumn Rd, Wrentham, MA 02093 and is currently estimated at $972,052, approximately $340 per square foot. 140 Autumn Rd is a home located in Norfolk County with nearby schools including Delaney Elementary School, Charles E Roderick, and Mercymount Country Day School.
Ownership History
Date
Name
Owned For
Owner Type
Purchase Details
Closed on
Sep 29, 2004
Sold by
Dalelio John
Bought by
Glebus Linda M and Glebus Martin R
Current Estimated Value
Purchase Details
Closed on
Jul 11, 2003
Sold by
Glebus Martin R and Glebus Linda M
Bought by
Alelio John D
Home Financials for this Owner
Home Financials are based on the most recent Mortgage that was taken out on this home.
Original Mortgage
$480,000
Interest Rate
5.45%
Mortgage Type
Purchase Money Mortgage
Create a Home Valuation Report for This Property
The Home Valuation Report is an in-depth analysis detailing your home's value as well as a comparison with similar homes in the area
Home Values in the Area
Average Home Value in this Area
Purchase History
| Date | Buyer | Sale Price | Title Company |
|---|---|---|---|
| Glebus Linda M | $600,000 | -- | |
| Alelio John D | $600,000 | -- |
Source: Public Records
Mortgage History
| Date | Status | Borrower | Loan Amount |
|---|---|---|---|
| Previous Owner | Alelio John D | $480,000 | |
| Previous Owner | Alelio John D | $60,000 |
Source: Public Records
Tax History Compared to Growth
Tax History
| Year | Tax Paid | Tax Assessment Tax Assessment Total Assessment is a certain percentage of the fair market value that is determined by local assessors to be the total taxable value of land and additions on the property. | Land | Improvement |
|---|---|---|---|---|
| 2025 | $9,277 | $800,400 | $288,100 | $512,300 |
| 2024 | $8,831 | $735,900 | $288,100 | $447,800 |
| 2023 | $8,857 | $701,800 | $262,000 | $439,800 |
| 2022 | $8,553 | $625,700 | $255,200 | $370,500 |
| 2021 | $8,151 | $579,300 | $238,500 | $340,800 |
| 2020 | $7,954 | $558,200 | $182,100 | $376,100 |
| 2019 | $7,639 | $541,000 | $182,100 | $358,900 |
| 2018 | $7,499 | $526,600 | $181,900 | $344,700 |
| 2017 | $7,290 | $511,600 | $178,300 | $333,300 |
| 2016 | $7,141 | $500,100 | $173,200 | $326,900 |
| 2015 | $7,163 | $478,200 | $166,500 | $311,700 |
| 2014 | $7,046 | $460,200 | $160,100 | $300,100 |
Source: Public Records
Map
Nearby Homes
- 60 Grant Ave
- 50 Wamsutta Way
- 50 Heather Ln
- 2095 West St
- 236 Williams St
- 39 Sumner Brown Rd
- 180 Pine Swamp Rd
- 56 Pine Swamp Rd
- 25 Nature View Dr
- 20 Nature View Dr
- 300 Tower Hill Rd
- 4022 Diamond Hill Rd
- 9 Pebble Cir Unit 9
- 219 Dawn Blvd
- 245 W Wrentham Rd
- 65 Palmetto Dr Unit 65
- 21 Palmetto Dr Unit 21
- 24 Palmetto Dr Unit 24
- 851 Washington St
- 17 Stanford Rd