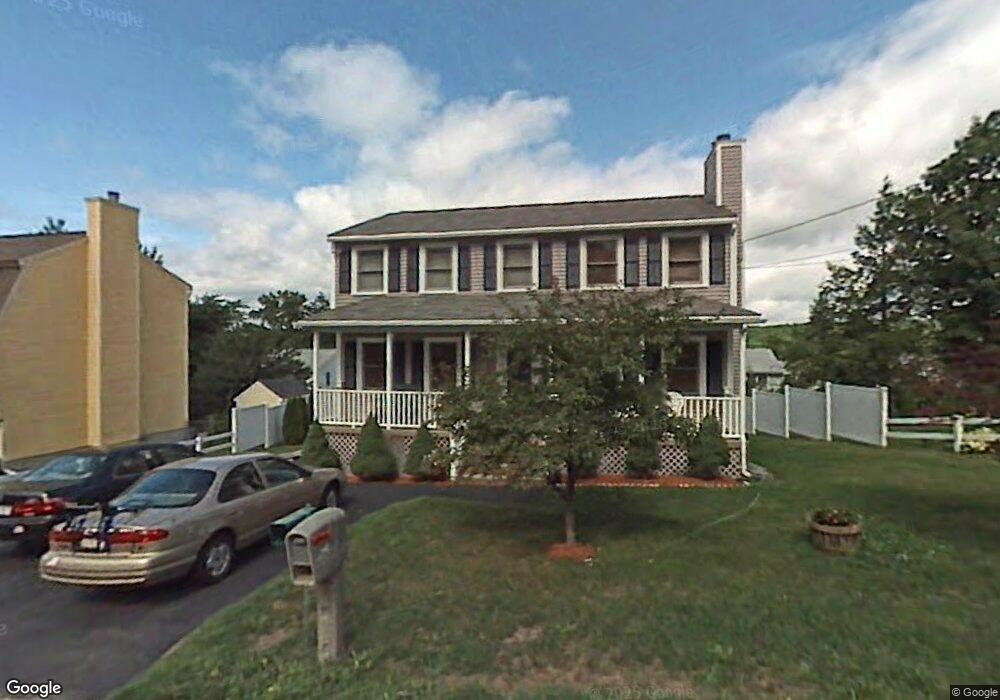
140 B St Dracut, MA 01826
Estimated Value: $503,000 - $642,000
3
Beds
2
Baths
1,632
Sq Ft
$357/Sq Ft
Est. Value
About This Home
This home is located at 140 B St, Dracut, MA 01826 and is currently estimated at $583,279, approximately $357 per square foot. 140 B St is a home located in Middlesex County with nearby schools including Brookside Elementary School, Richardson Middle School, and Dracut Senior High School.
Ownership History
Date
Name
Owned For
Owner Type
Purchase Details
Closed on
Mar 17, 2025
Sold by
Bettencourt Mark F
Bought by
Bettencourt Mark F and Lemieux Colette M
Current Estimated Value
Purchase Details
Closed on
Jan 3, 1994
Sold by
Catalano Linda
Bought by
Bettencourt Dorette A
Purchase Details
Closed on
Aug 31, 1993
Sold by
Distefano Roberto and Distefano Adriana
Bought by
Catalano Linda
Home Financials for this Owner
Home Financials are based on the most recent Mortgage that was taken out on this home.
Original Mortgage
$80,000
Interest Rate
6.9%
Create a Home Valuation Report for This Property
The Home Valuation Report is an in-depth analysis detailing your home's value as well as a comparison with similar homes in the area
Home Values in the Area
Average Home Value in this Area
Purchase History
| Date | Buyer | Sale Price | Title Company |
|---|---|---|---|
| Bettencourt Mark F | -- | None Available | |
| Bettencourt Mark F | -- | None Available | |
| Bettencourt Dorette A | $142,000 | -- | |
| Bettencourt Dorette A | $142,000 | -- | |
| Catalano Linda | $41,000 | -- | |
| Catalano Linda | $41,000 | -- |
Source: Public Records
Mortgage History
| Date | Status | Borrower | Loan Amount |
|---|---|---|---|
| Previous Owner | Catalano Linda | $80,000 | |
| Previous Owner | Catalano Linda | $85,000 | |
| Previous Owner | Catalano Linda | $80,000 |
Source: Public Records
Tax History Compared to Growth
Tax History
| Year | Tax Paid | Tax Assessment Tax Assessment Total Assessment is a certain percentage of the fair market value that is determined by local assessors to be the total taxable value of land and additions on the property. | Land | Improvement |
|---|---|---|---|---|
| 2025 | $4,857 | $479,900 | $177,100 | $302,800 |
| 2024 | $4,677 | $447,600 | $168,600 | $279,000 |
| 2023 | $4,530 | $391,200 | $146,600 | $244,600 |
| 2022 | $4,388 | $357,000 | $133,300 | $223,700 |
| 2021 | $4,334 | $333,100 | $121,200 | $211,900 |
| 2020 | $4,192 | $314,000 | $117,600 | $196,400 |
| 2019 | $3,990 | $290,200 | $112,000 | $178,200 |
| 2018 | $3,995 | $282,500 | $112,000 | $170,500 |
| 2017 | $3,961 | $282,500 | $112,000 | $170,500 |
| 2016 | $3,931 | $264,900 | $107,700 | $157,200 |
| 2015 | $3,788 | $253,700 | $107,700 | $146,000 |
| 2014 | $3,537 | $244,100 | $107,700 | $136,400 |
Source: Public Records
Map
Nearby Homes