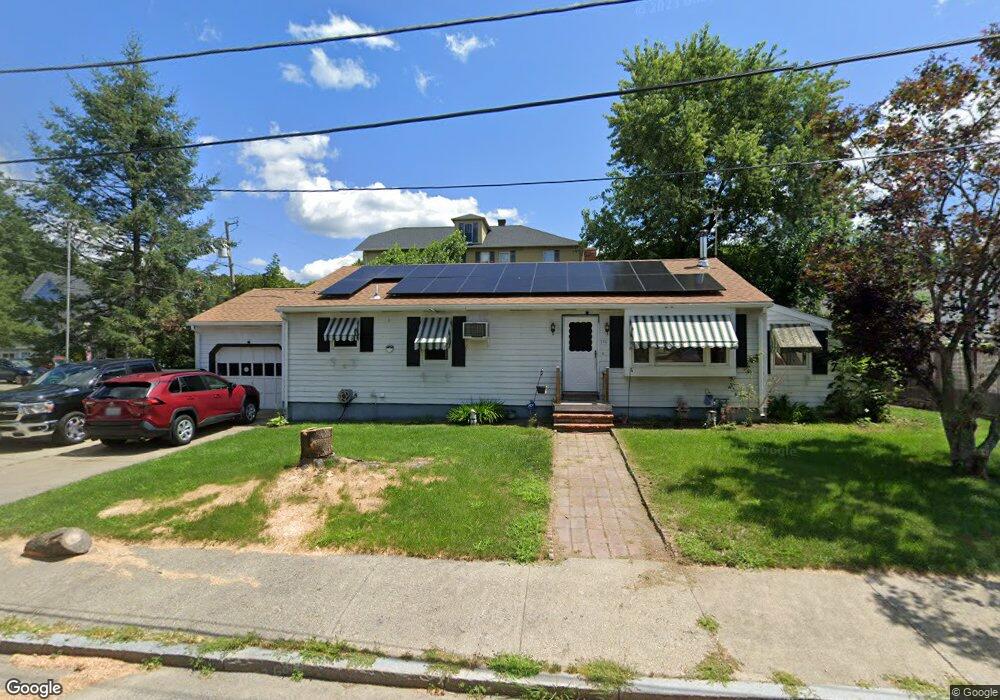
140 Bailey St Woonsocket, RI 02895
Globe District NeighborhoodEstimated Value: $375,000 - $414,000
3
Beds
3
Baths
2,042
Sq Ft
$193/Sq Ft
Est. Value
About This Home
This home is located at 140 Bailey St, Woonsocket, RI 02895 and is currently estimated at $393,097, approximately $192 per square foot. 140 Bailey St is a home located in Providence County with nearby schools including Woonsocket High School, Founders Academy, and Beacon Charter School.
Ownership History
Date
Name
Owned For
Owner Type
Purchase Details
Closed on
Dec 20, 2002
Sold by
Froment Richard E and Froment Carleen C
Bought by
Blais Alan R and Blais Kathleen L
Current Estimated Value
Home Financials for this Owner
Home Financials are based on the most recent Mortgage that was taken out on this home.
Original Mortgage
$152,000
Interest Rate
6.16%
Create a Home Valuation Report for This Property
The Home Valuation Report is an in-depth analysis detailing your home's value as well as a comparison with similar homes in the area
Home Values in the Area
Average Home Value in this Area
Purchase History
| Date | Buyer | Sale Price | Title Company |
|---|---|---|---|
| Blais Alan R | $190,000 | -- | |
| Blais Alan R | $190,000 | -- |
Source: Public Records
Mortgage History
| Date | Status | Borrower | Loan Amount |
|---|---|---|---|
| Open | Blais Alan R | $186,300 | |
| Closed | Blais Alan R | $152,000 |
Source: Public Records
Tax History
| Year | Tax Paid | Tax Assessment Tax Assessment Total Assessment is a certain percentage of the fair market value that is determined by local assessors to be the total taxable value of land and additions on the property. | Land | Improvement |
|---|---|---|---|---|
| 2025 | $4,320 | $384,700 | $107,300 | $277,400 |
| 2024 | $4,071 | $280,000 | $95,100 | $184,900 |
| 2023 | $3,914 | $280,000 | $95,100 | $184,900 |
| 2022 | $3,914 | $280,000 | $95,100 | $184,900 |
| 2021 | $3,869 | $162,900 | $59,800 | $103,100 |
| 2020 | $3,910 | $162,900 | $59,800 | $103,100 |
| 2018 | $3,923 | $162,900 | $59,800 | $103,100 |
| 2017 | $4,148 | $137,800 | $46,700 | $91,100 |
| 2016 | $4,388 | $137,800 | $46,700 | $91,100 |
| 2015 | $5,041 | $137,800 | $46,700 | $91,100 |
| 2014 | $5,100 | $141,900 | $51,400 | $90,500 |
Source: Public Records
Map
Nearby Homes
- 80 Summit St
- 43 Summit St
- 184 Avenue C Unit 2
- 184 Avenue C Unit 5
- 184 Avenue C Unit 6
- 184 Avenue C Unit 3
- 184 Avenue C Unit 4
- 184 Avenue C Unit 1
- 190 Coe St
- 1 Admiral St
- 122 Grand St
- 604 Providence St
- 435 S Main St
- 0 Holbrook Ln Unit 1402850
- 25 Ormond St
- 15 Knight St
- 84 Bernice Ave
- 379 Front St
- 92 Rockland Ave
- 147 Warwick St
Your Personal Tour Guide
Ask me questions while you tour the home.