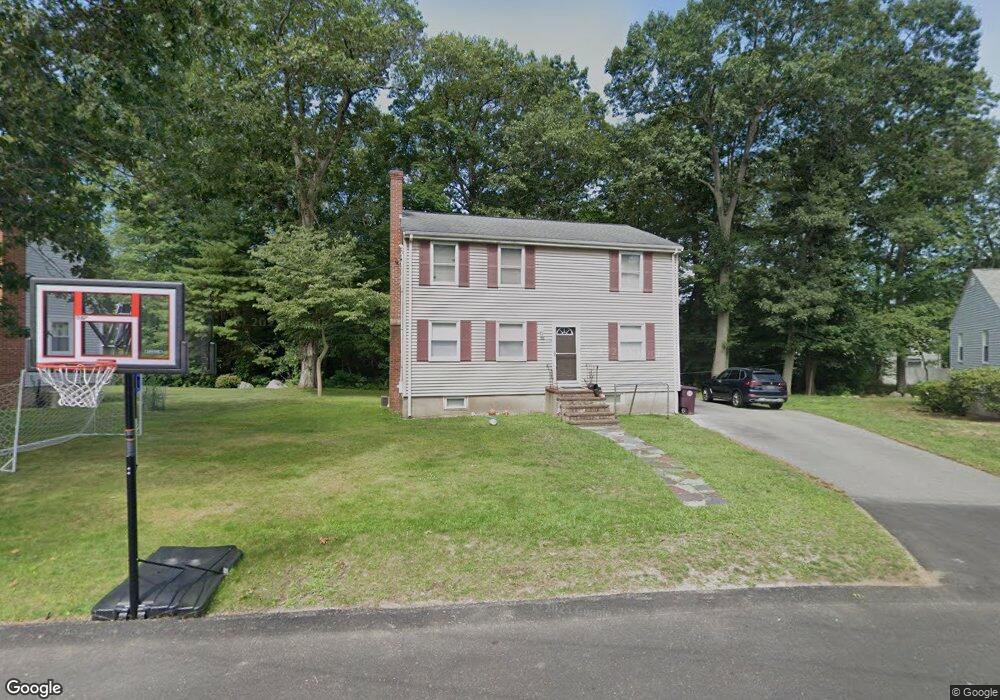
140 Belmont St Weymouth, MA 02188
South Weymouth NeighborhoodEstimated Value: $623,000 - $730,000
2
Beds
1
Bath
1,664
Sq Ft
$408/Sq Ft
Est. Value
About This Home
This home is located at 140 Belmont St, Weymouth, MA 02188 and is currently estimated at $678,785, approximately $407 per square foot. 140 Belmont St is a home located in Norfolk County with nearby schools including Frederick C Murphy, Abigail Adams Middle School, and Weymouth Middle School Chapman.
Ownership History
Date
Name
Owned For
Owner Type
Purchase Details
Closed on
Sep 29, 1997
Sold by
Tonsing Verda E Est
Bought by
Rosemond Robert J and Rosemond Brenda D
Current Estimated Value
Home Financials for this Owner
Home Financials are based on the most recent Mortgage that was taken out on this home.
Original Mortgage
$118,700
Outstanding Balance
$19,104
Interest Rate
7.47%
Mortgage Type
Purchase Money Mortgage
Estimated Equity
$659,681
Create a Home Valuation Report for This Property
The Home Valuation Report is an in-depth analysis detailing your home's value as well as a comparison with similar homes in the area
Home Values in the Area
Average Home Value in this Area
Purchase History
| Date | Buyer | Sale Price | Title Company |
|---|---|---|---|
| Rosemond Robert J | $125,000 | -- |
Source: Public Records
Mortgage History
| Date | Status | Borrower | Loan Amount |
|---|---|---|---|
| Open | Rosemond Robert J | $118,700 |
Source: Public Records
Tax History Compared to Growth
Tax History
| Year | Tax Paid | Tax Assessment Tax Assessment Total Assessment is a certain percentage of the fair market value that is determined by local assessors to be the total taxable value of land and additions on the property. | Land | Improvement |
|---|---|---|---|---|
| 2025 | $6,178 | $611,700 | $257,600 | $354,100 |
| 2024 | $6,037 | $587,800 | $245,400 | $342,400 |
| 2023 | $5,640 | $539,700 | $227,200 | $312,500 |
| 2022 | $5,299 | $462,400 | $192,800 | $269,600 |
| 2021 | $5,039 | $429,200 | $192,800 | $236,400 |
| 2020 | $4,840 | $406,000 | $192,800 | $213,200 |
| 2019 | $4,755 | $392,300 | $185,400 | $206,900 |
| 2018 | $4,604 | $368,300 | $176,600 | $191,700 |
| 2017 | $4,158 | $324,600 | $168,200 | $156,400 |
| 2016 | $4,024 | $314,400 | $161,700 | $152,700 |
| 2015 | $3,838 | $297,500 | $154,400 | $143,100 |
| 2014 | $3,701 | $278,300 | $143,700 | $134,600 |
Source: Public Records
Map
Nearby Homes
- 116 Belmont St
- 200 Justin Dr Unit 3
- 501 Commerce Dr Unit 2310
- 501 Commerce Dr Unit 1111
- 501 Commerce Dr Unit 4206
- 501 Commerce Dr Unit 4308
- 501 Commerce Dr Unit 4306
- 655 Summer St
- 255 West St
- 262 West St
- 92 Mercury St
- 2 Tara Dr Unit 1
- 54 Federal St
- 24 Blake Rd
- 432 Grove St
- 441 Grove St
- 67 Abby Rd
- 972 Liberty St
- 2 Mitchell Ln Unit B
- 747 Middle St