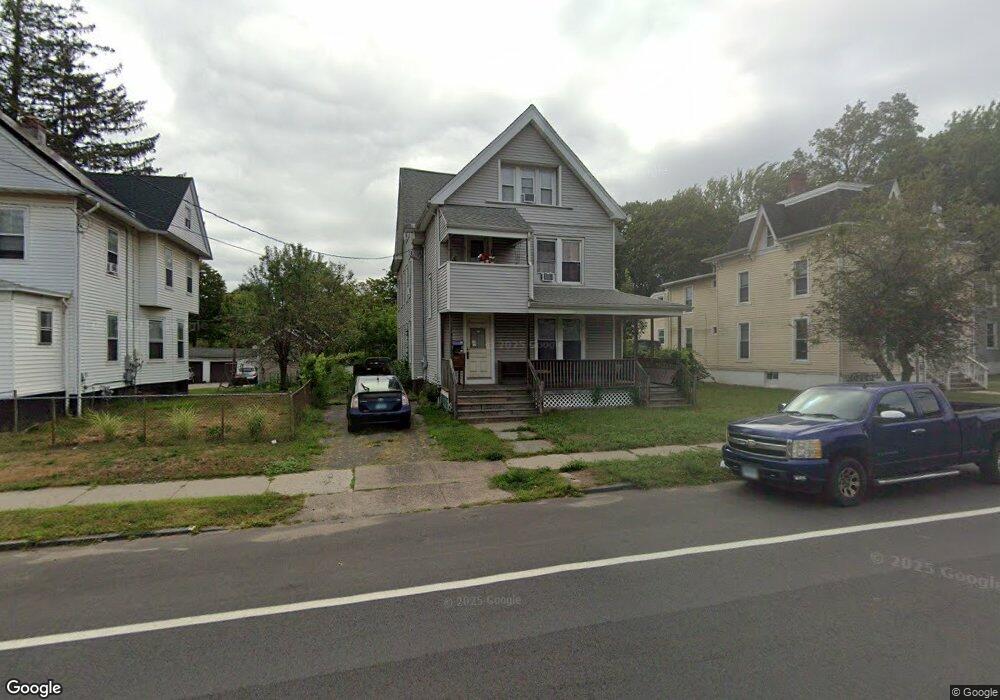
140 Cook Ave Meriden, CT 06451
Estimated Value: $418,000 - $1,232,106
6
Beds
3
Baths
3,719
Sq Ft
$174/Sq Ft
Est. Value
About This Home
This home is located at 140 Cook Ave, Meriden, CT 06451 and is currently estimated at $647,027, approximately $173 per square foot. 140 Cook Ave is a home located in New Haven County with nearby schools including Casimir Pulaski School, Lincoln Middle School, and Orville H. Platt High School.
Ownership History
Date
Name
Owned For
Owner Type
Purchase Details
Closed on
Jul 20, 2021
Sold by
Grabowski Liana M and Grabowski Daniel
Bought by
Townley Ft and Townley
Current Estimated Value
Purchase Details
Closed on
Dec 18, 1996
Sold by
Sowamco Xxiv Ltd
Bought by
Cousino Joseph Handel
Purchase Details
Closed on
Feb 10, 1995
Sold by
Dime Sb Wallingford
Bought by
Sowamco 4Th Ltd
Home Financials for this Owner
Home Financials are based on the most recent Mortgage that was taken out on this home.
Original Mortgage
$52,338
Interest Rate
9.18%
Create a Home Valuation Report for This Property
The Home Valuation Report is an in-depth analysis detailing your home's value as well as a comparison with similar homes in the area
Home Values in the Area
Average Home Value in this Area
Purchase History
| Date | Buyer | Sale Price | Title Company |
|---|---|---|---|
| Townley Ft | $825,000 | None Available | |
| Cousino Joseph Handel | $35,000 | -- | |
| Sowamco 4Th Ltd | $52,000 | -- |
Source: Public Records
Mortgage History
| Date | Status | Borrower | Loan Amount |
|---|---|---|---|
| Previous Owner | Sowamco 4Th Ltd | $52,338 |
Source: Public Records
Tax History Compared to Growth
Tax History
| Year | Tax Paid | Tax Assessment Tax Assessment Total Assessment is a certain percentage of the fair market value that is determined by local assessors to be the total taxable value of land and additions on the property. | Land | Improvement |
|---|---|---|---|---|
| 2025 | $6,722 | $177,310 | $29,680 | $147,630 |
| 2024 | $6,828 | $177,310 | $29,680 | $147,630 |
| 2023 | $6,582 | $177,310 | $29,680 | $147,630 |
| 2022 | $6,209 | $177,310 | $29,680 | $147,630 |
| 2021 | $5,314 | $122,080 | $22,470 | $99,610 |
| 2020 | $5,299 | $122,080 | $22,470 | $99,610 |
| 2019 | $5,254 | $122,080 | $22,470 | $99,610 |
| 2018 | $5,275 | $122,080 | $22,470 | $99,610 |
| 2017 | $5,135 | $122,080 | $22,470 | $99,610 |
| 2016 | $5,848 | $150,850 | $38,850 | $112,000 |
| 2015 | $5,848 | $150,850 | $38,850 | $112,000 |
| 2014 | $5,707 | $150,850 | $38,850 | $112,000 |
Source: Public Records
Map
Nearby Homes