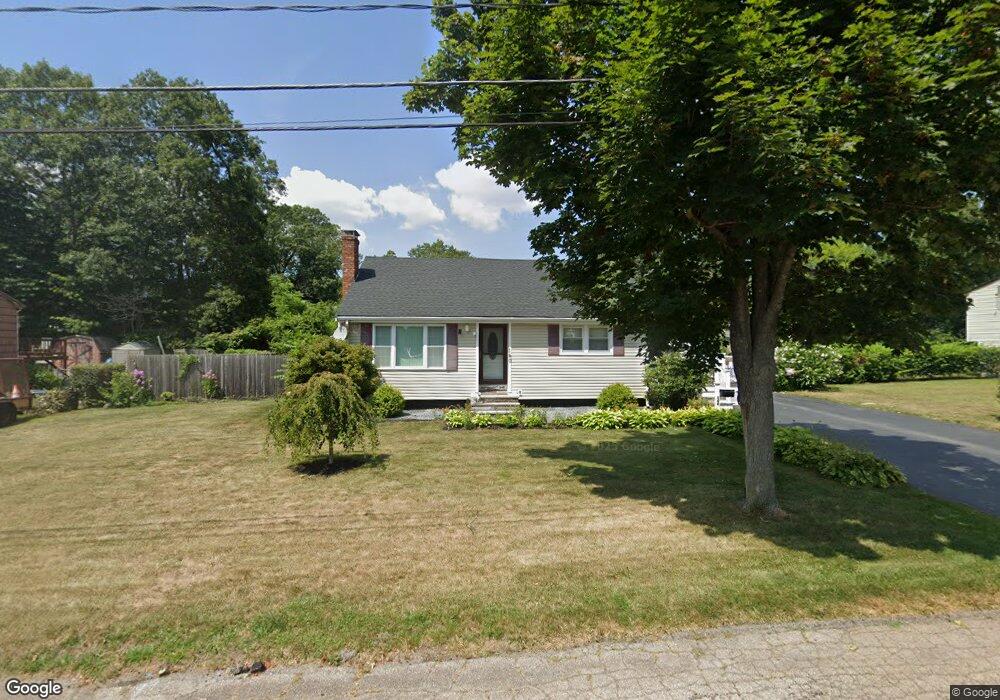
140 Dixon Rd Brockton, MA 02302
Montello NeighborhoodEstimated Value: $471,000 - $535,000
3
Beds
1
Bath
1,420
Sq Ft
$360/Sq Ft
Est. Value
About This Home
This home is located at 140 Dixon Rd, Brockton, MA 02302 and is currently estimated at $511,329, approximately $360 per square foot. 140 Dixon Rd is a home located in Plymouth County with nearby schools including Brookfield Elementary School, Downey Elementary School, and Ashfield Middle School.
Ownership History
Date
Name
Owned For
Owner Type
Purchase Details
Closed on
Dec 28, 1993
Sold by
Shawmut Bk Na
Bought by
Lopes Rosa V and Lopes Eugenia V
Current Estimated Value
Purchase Details
Closed on
Apr 16, 1993
Sold by
Peoples Bank
Bought by
Shawmut Bank N A
Purchase Details
Closed on
Mar 16, 1993
Sold by
Barnes William B and Peoples Bank
Bought by
Peoples Bank
Create a Home Valuation Report for This Property
The Home Valuation Report is an in-depth analysis detailing your home's value as well as a comparison with similar homes in the area
Home Values in the Area
Average Home Value in this Area
Purchase History
| Date | Buyer | Sale Price | Title Company |
|---|---|---|---|
| Lopes Rosa V | $70,000 | -- | |
| Shawmut Bank N A | $102,458 | -- | |
| Peoples Bank | $116,259 | -- |
Source: Public Records
Mortgage History
| Date | Status | Borrower | Loan Amount |
|---|---|---|---|
| Open | Peoples Bank | $167,500 | |
| Closed | Peoples Bank | $28,185 |
Source: Public Records
Tax History Compared to Growth
Tax History
| Year | Tax Paid | Tax Assessment Tax Assessment Total Assessment is a certain percentage of the fair market value that is determined by local assessors to be the total taxable value of land and additions on the property. | Land | Improvement |
|---|---|---|---|---|
| 2025 | $5,368 | $443,300 | $146,500 | $296,800 |
| 2024 | $5,047 | $419,900 | $146,500 | $273,400 |
| 2023 | $4,582 | $353,000 | $111,600 | $241,400 |
| 2022 | $4,537 | $324,800 | $101,500 | $223,300 |
| 2021 | $4,282 | $295,300 | $96,000 | $199,300 |
| 2020 | $4,362 | $287,900 | $91,900 | $196,000 |
| 2019 | $4,149 | $267,000 | $86,300 | $180,700 |
| 2018 | $3,959 | $246,500 | $86,300 | $160,200 |
| 2017 | $3,632 | $225,600 | $86,300 | $139,300 |
| 2016 | $3,691 | $212,600 | $82,300 | $130,300 |
| 2015 | $3,276 | $180,500 | $82,300 | $98,200 |
| 2014 | $3,296 | $181,800 | $82,300 | $99,500 |
Source: Public Records
Map
Nearby Homes