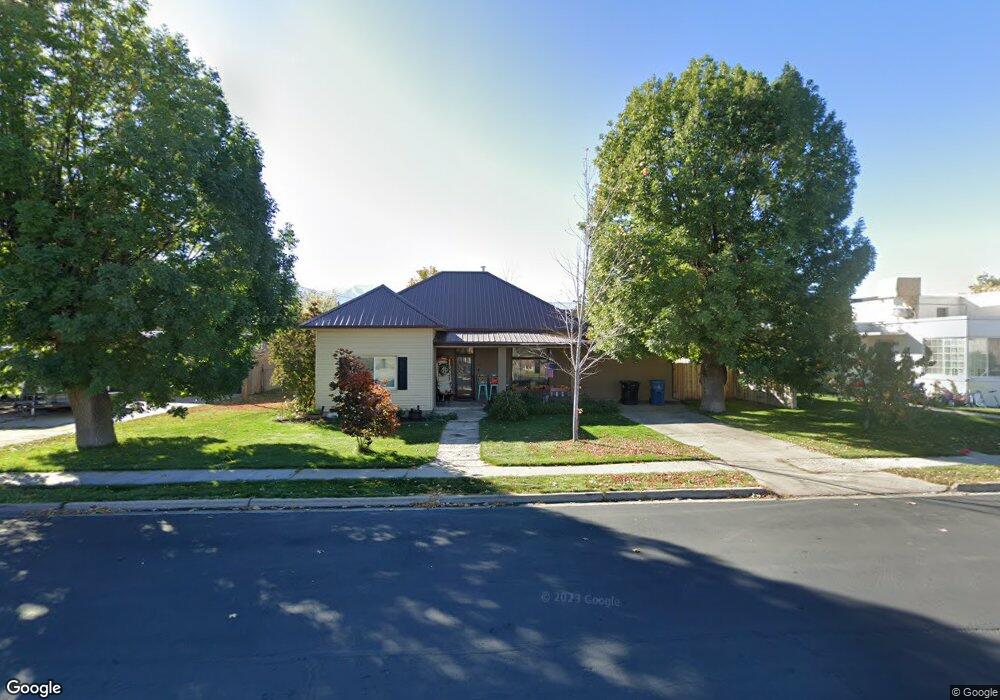
140 E 100 N Spanish Fork, UT 84660
Estimated Value: $433,000 - $495,746
3
Beds
1
Bath
2,157
Sq Ft
$215/Sq Ft
Est. Value
About This Home
This home is located at 140 E 100 N, Spanish Fork, UT 84660 and is currently estimated at $464,249, approximately $215 per square foot. 140 E 100 N is a home located in Utah County with nearby schools including Park Elementary School, Spanish Fork Jr High School, and Spanish Fork High School.
Ownership History
Date
Name
Owned For
Owner Type
Purchase Details
Closed on
Aug 14, 2008
Sold by
Christopherson Sam Earl
Bought by
Christopherson Sam Earl and Christopherson Hillary
Current Estimated Value
Home Financials for this Owner
Home Financials are based on the most recent Mortgage that was taken out on this home.
Original Mortgage
$158,500
Outstanding Balance
$103,977
Interest Rate
6.32%
Mortgage Type
New Conventional
Estimated Equity
$360,272
Purchase Details
Closed on
Aug 18, 2005
Sold by
Sprengle Danny J and Sprengle Gale L
Bought by
Christopherson Sam Earl
Home Financials for this Owner
Home Financials are based on the most recent Mortgage that was taken out on this home.
Original Mortgage
$139,200
Interest Rate
5.56%
Mortgage Type
Fannie Mae Freddie Mac
Create a Home Valuation Report for This Property
The Home Valuation Report is an in-depth analysis detailing your home's value as well as a comparison with similar homes in the area
Home Values in the Area
Average Home Value in this Area
Purchase History
| Date | Buyer | Sale Price | Title Company |
|---|---|---|---|
| Christopherson Sam Earl | -- | Accommodation | |
| Christopherson Sam Earl | -- | Title West Title Company |
Source: Public Records
Mortgage History
| Date | Status | Borrower | Loan Amount |
|---|---|---|---|
| Open | Christopherson Sam Earl | $158,500 | |
| Closed | Christopherson Sam Earl | $139,200 |
Source: Public Records
Tax History
| Year | Tax Paid | Tax Assessment Tax Assessment Total Assessment is a certain percentage of the fair market value that is determined by local assessors to be the total taxable value of land and additions on the property. | Land | Improvement |
|---|---|---|---|---|
| 2025 | $2,035 | $233,695 | -- | -- |
| 2024 | $2,035 | $209,715 | $0 | $0 |
| 2023 | $2,009 | $207,350 | $0 | $0 |
| 2022 | $1,950 | $197,395 | $0 | $0 |
| 2021 | $1,658 | $268,400 | $92,800 | $175,600 |
| 2020 | $1,496 | $235,500 | $77,300 | $158,200 |
| 2019 | $1,386 | $229,600 | $77,300 | $152,300 |
| 2018 | $1,310 | $209,700 | $77,300 | $132,400 |
| 2017 | $1,147 | $98,725 | $0 | $0 |
| 2016 | $1,038 | $88,110 | $0 | $0 |
| 2015 | $1,037 | $87,010 | $0 | $0 |
| 2014 | $951 | $80,080 | $0 | $0 |
Source: Public Records
Map
Nearby Homes
Your Personal Tour Guide
Ask me questions while you tour the home.