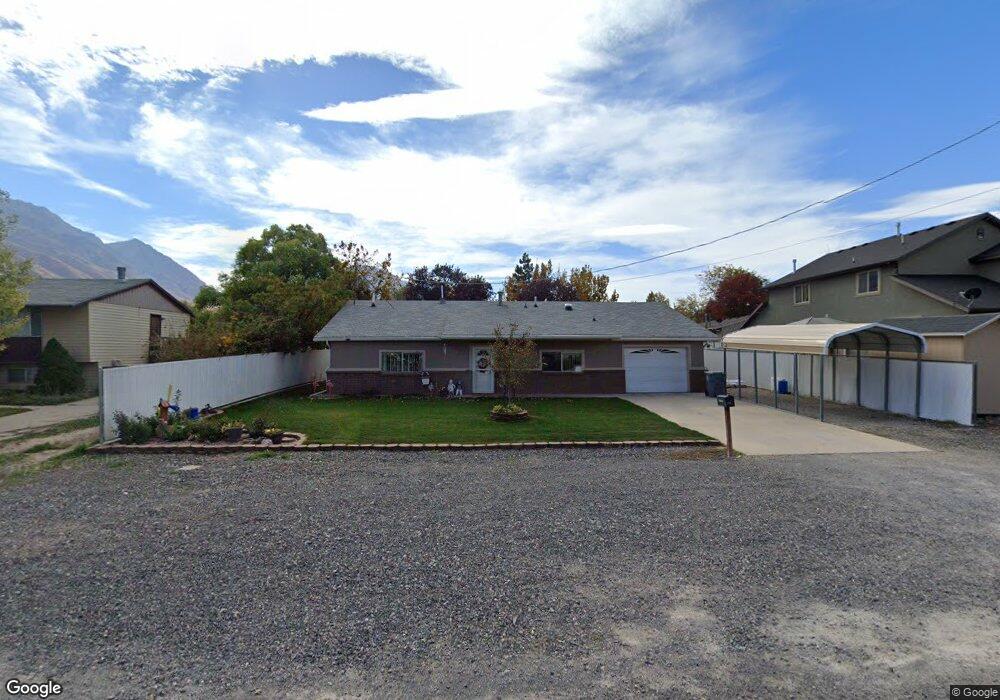
140 E 200 N Santaquin, UT 84655
Estimated Value: $448,000 - $470,000
3
Beds
3
Baths
1,864
Sq Ft
$245/Sq Ft
Est. Value
About This Home
This home is located at 140 E 200 N, Santaquin, UT 84655 and is currently estimated at $456,827, approximately $245 per square foot. 140 E 200 N is a home located in Utah County with nearby schools including Apple Valley Elementary, Payson Junior High School, and Mt. Nebo Middle.
Ownership History
Date
Name
Owned For
Owner Type
Purchase Details
Closed on
Nov 25, 2019
Sold by
Forbush Cleora
Bought by
Forbush Cleora and The Cleora Forbush Revocable T
Current Estimated Value
Purchase Details
Closed on
Feb 14, 2006
Sold by
Forbush Cleora E
Bought by
Milton & Cleora Forbush Trust and Forbush Cleora
Purchase Details
Closed on
Jan 31, 1998
Sold by
Forbush Milton J and Forbush Cleora E
Bought by
Milton & Cleora Forbush Family Trust
Create a Home Valuation Report for This Property
The Home Valuation Report is an in-depth analysis detailing your home's value as well as a comparison with similar homes in the area
Home Values in the Area
Average Home Value in this Area
Purchase History
| Date | Buyer | Sale Price | Title Company |
|---|---|---|---|
| Forbush Cleora | -- | None Available | |
| Forbush Cleora | -- | None Available | |
| Forbush Cleora | -- | None Available | |
| Milton & Cleora Forbush Trust | -- | None Available | |
| Milton & Cleora Forbush Family Trust | -- | -- |
Source: Public Records
Tax History
| Year | Tax Paid | Tax Assessment Tax Assessment Total Assessment is a certain percentage of the fair market value that is determined by local assessors to be the total taxable value of land and additions on the property. | Land | Improvement |
|---|---|---|---|---|
| 2025 | $2,007 | $223,025 | -- | -- |
| 2024 | $2,007 | $199,870 | $0 | $0 |
| 2023 | $2,075 | $207,295 | $0 | $0 |
| 2022 | $2,129 | $219,395 | $0 | $0 |
| 2021 | $1,828 | $292,000 | $73,100 | $218,900 |
| 2020 | $1,752 | $271,100 | $63,600 | $207,500 |
| 2019 | $1,627 | $257,600 | $60,100 | $197,500 |
| 2018 | $1,599 | $241,400 | $56,500 | $184,900 |
| 2017 | $1,482 | $119,515 | $0 | $0 |
| 2016 | $1,295 | $102,300 | $0 | $0 |
| 2015 | $1,244 | $96,415 | $0 | $0 |
| 2014 | $1,242 | $96,085 | $0 | $0 |
Source: Public Records
Map
Nearby Homes
Your Personal Tour Guide
Ask me questions while you tour the home.