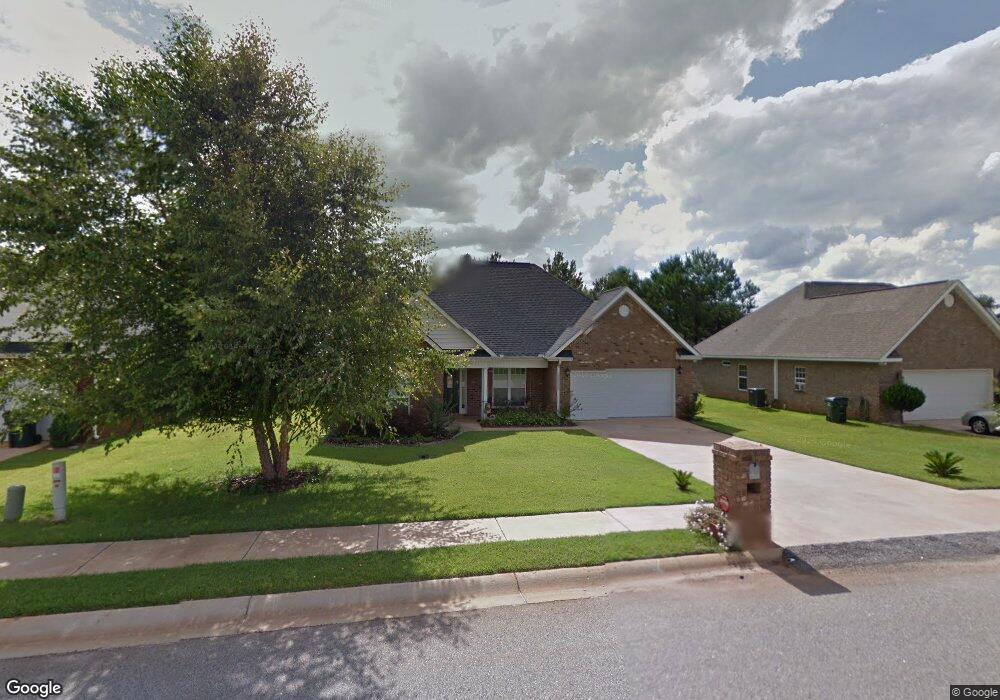
140 Emberly Ln Warner Robins, GA 31088
Estimated Value: $262,000 - $281,000
3
Beds
2
Baths
1,785
Sq Ft
$152/Sq Ft
Est. Value
About This Home
This home is located at 140 Emberly Ln, Warner Robins, GA 31088 and is currently estimated at $270,863, approximately $151 per square foot. 140 Emberly Ln is a home located in Houston County with nearby schools including Quail Run Elementary School, Warner Robins Middle School, and Houston County High School.
Ownership History
Date
Name
Owned For
Owner Type
Purchase Details
Closed on
Feb 4, 2020
Sold by
Connell Sharon A
Bought by
Lamb Jason A
Current Estimated Value
Home Financials for this Owner
Home Financials are based on the most recent Mortgage that was taken out on this home.
Original Mortgage
$182,000
Outstanding Balance
$161,575
Interest Rate
3.74%
Mortgage Type
VA
Estimated Equity
$109,288
Purchase Details
Closed on
May 28, 2010
Sold by
Mesco Thomas J and Mesco Ann M
Bought by
Connell Sharon A
Home Financials for this Owner
Home Financials are based on the most recent Mortgage that was taken out on this home.
Original Mortgage
$173,957
Interest Rate
5.03%
Mortgage Type
VA
Purchase Details
Closed on
Oct 7, 2005
Sold by
Prime Homes Inc
Bought by
Mesco Thomas J and Ann M*
Purchase Details
Closed on
Jan 19, 2005
Sold by
The Stoker Group Inc
Bought by
Primo Homes Inc
Home Financials for this Owner
Home Financials are based on the most recent Mortgage that was taken out on this home.
Original Mortgage
$100,688
Interest Rate
5.75%
Mortgage Type
Purchase Money Mortgage
Create a Home Valuation Report for This Property
The Home Valuation Report is an in-depth analysis detailing your home's value as well as a comparison with similar homes in the area
Home Values in the Area
Average Home Value in this Area
Purchase History
| Date | Buyer | Sale Price | Title Company |
|---|---|---|---|
| Lamb Jason A | $182,000 | None Available | |
| Connell Sharon A | $168,400 | None Available | |
| Mesco Thomas J | $163,900 | -- | |
| Primo Homes Inc | $23,000 | None Available |
Source: Public Records
Mortgage History
| Date | Status | Borrower | Loan Amount |
|---|---|---|---|
| Open | Lamb Jason A | $182,000 | |
| Previous Owner | Connell Sharon A | $173,957 | |
| Previous Owner | Primo Homes Inc | $100,688 |
Source: Public Records
Tax History Compared to Growth
Tax History
| Year | Tax Paid | Tax Assessment Tax Assessment Total Assessment is a certain percentage of the fair market value that is determined by local assessors to be the total taxable value of land and additions on the property. | Land | Improvement |
|---|---|---|---|---|
| 2024 | -- | $90,440 | $8,800 | $81,640 |
| 2023 | $0 | $79,160 | $8,800 | $70,360 |
| 2022 | $2,424 | $73,520 | $8,800 | $64,720 |
| 2021 | $1,651 | $71,400 | $8,800 | $62,600 |
| 2020 | $1,405 | $62,480 | $8,800 | $53,680 |
| 2019 | $1,405 | $62,480 | $8,800 | $53,680 |
| 2018 | $1,405 | $62,480 | $8,800 | $53,680 |
| 2017 | $1,406 | $62,480 | $8,800 | $53,680 |
| 2016 | $1,409 | $62,480 | $8,800 | $53,680 |
| 2015 | -- | $62,480 | $8,800 | $53,680 |
| 2014 | -- | $65,200 | $8,800 | $56,400 |
| 2013 | -- | $65,200 | $8,800 | $56,400 |
Source: Public Records
Map
Nearby Homes
- 138 Emberly Ln
- 142 Emberly Ln
- .6 Acres Tharpe Rd
- 2.0 Acres Tharpe Rd
- 136 Emberly Ln
- 234 Sedgebrooke Dr
- 135 Emberly Ln
- 289 Tharpe Rd
- 291 Tharpe Rd
- 134 Emberly Ln
- 232 Sedgebrooke Dr
- 303 Sedgebrooke Dr
- 301 Sedgebrooke Dr
- 130 Emberly Ln
- 133 Emberly Ln
- 293 Tharpe Rd
- 132 Emberly Ln
- 237 Sedgebrooke Dr
- 221 Scotsburg Dr
- 230 Sedgebrooke Dr