Estimated Value: $260,000 - $337,000
5
Beds
3
Baths
2,288
Sq Ft
$132/Sq Ft
Est. Value
About This Home
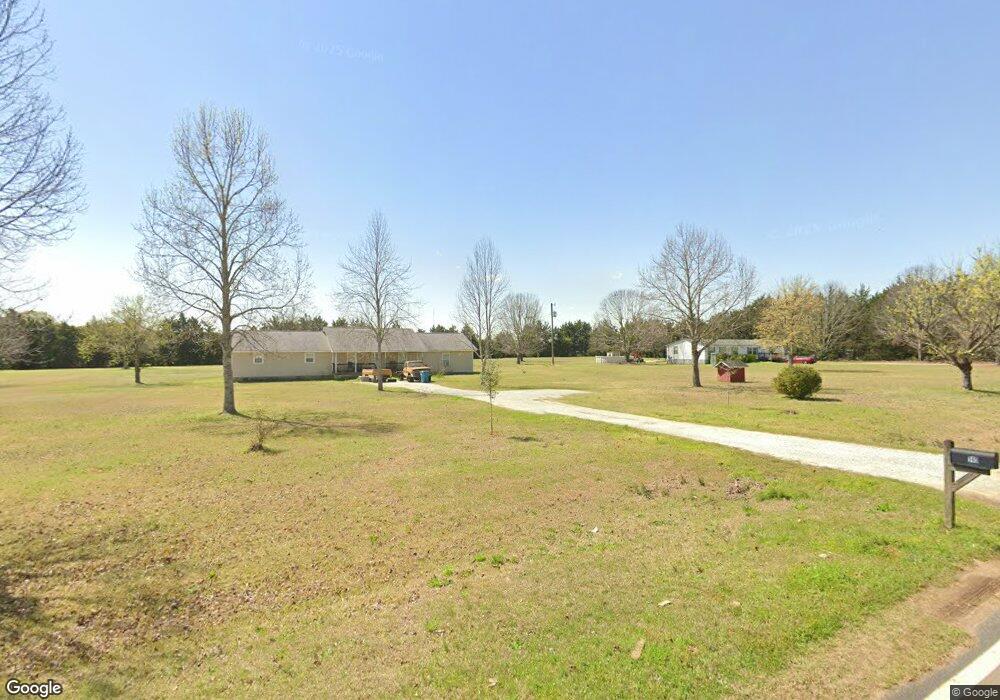
This home is located at 140 Fieldcrest Dr, Byron, GA 31008 and is currently estimated at $302,403, approximately $132 per square foot. 140 Fieldcrest Dr is a home located in Peach County with nearby schools including Kay Road Elementary School, Fort Valley Middle School, and Peach County High School.
Ownership History
Date
Name
Owned For
Owner Type
Purchase Details
Closed on
May 27, 2010
Sold by
Jeffers John D
Bought by
Waterman Timothy J
Current Estimated Value
Home Financials for this Owner
Home Financials are based on the most recent Mortgage that was taken out on this home.
Original Mortgage
$130,750
Outstanding Balance
$86,404
Interest Rate
5%
Mortgage Type
New Conventional
Estimated Equity
$215,999
Purchase Details
Closed on
Mar 25, 2009
Sold by
Southern Oaks Diversified Llc
Bought by
Jeffers Jr John D
Purchase Details
Closed on
Jan 1, 2009
Sold by
Jeffers Jr John D
Bought by
Jeffers Jr John D and Jeffers Jr Dena M
Purchase Details
Closed on
Dec 29, 2003
Sold by
The Bank Of New York As Truste
Bought by
Southern Oaks Diversified Llc
Purchase Details
Closed on
Nov 5, 2002
Sold by
Nix Robert L and Nix Joyce W
Bought by
The Bank Of New York As Trustee
Purchase Details
Closed on
Jun 13, 1994
Bought by
Nix Robert L and Nix Joyce W
Purchase Details
Closed on
Dec 21, 1990
Bought by
James Emory Inc
Create a Home Valuation Report for This Property
The Home Valuation Report is an in-depth analysis detailing your home's value as well as a comparison with similar homes in the area
Home Values in the Area
Average Home Value in this Area
Purchase History
| Date | Buyer | Sale Price | Title Company |
|---|---|---|---|
| Waterman Timothy J | $128,000 | -- | |
| Jeffers John D | -- | -- | |
| Jeffers Jr John D | -- | -- | |
| Jeffers Jr John D | -- | -- | |
| Southern Oaks Diversified Llc | -- | -- | |
| The Bank Of New York As Trustee | -- | -- | |
| Nix Robert L | -- | -- | |
| James Emory Inc | -- | -- |
Source: Public Records
Mortgage History
| Date | Status | Borrower | Loan Amount |
|---|---|---|---|
| Open | Waterman Timothy J | $130,750 |
Source: Public Records
Tax History
| Year | Tax Paid | Tax Assessment Tax Assessment Total Assessment is a certain percentage of the fair market value that is determined by local assessors to be the total taxable value of land and additions on the property. | Land | Improvement |
|---|---|---|---|---|
| 2025 | $2,457 | $87,040 | $7,760 | $79,280 |
| 2024 | $2,466 | $84,760 | $8,000 | $76,760 |
| 2023 | $2,477 | $84,440 | $8,000 | $76,440 |
| 2022 | $2,226 | $75,120 | $8,000 | $67,120 |
| 2021 | $2,240 | $65,200 | $8,000 | $57,200 |
| 2020 | $2,313 | $67,560 | $8,000 | $59,560 |
| 2019 | $2,324 | $67,560 | $8,000 | $59,560 |
| 2018 | $2,039 | $58,200 | $8,000 | $50,200 |
| 2017 | $2,048 | $58,200 | $8,000 | $50,200 |
| 2016 | $2,041 | $58,200 | $8,000 | $50,200 |
| 2015 | $2,043 | $58,200 | $8,000 | $50,200 |
| 2014 | $2,046 | $58,200 | $8,000 | $50,200 |
| 2013 | -- | $58,200 | $8,000 | $50,200 |
Source: Public Records
Map
Nearby Homes
- 129 Amanda Dr
- 800 John E Sullivan Rd
- 19C Crown Ct
- 204 Brandon Way
- 0 Housers Mill Rd Unit 5515996
- 109 Red Tail Cir
- 116 Early Dr
- 161 Rowland Cir
- 3379 Housers Mill Rd
- 115 Early Dr
- 119 Early Dr
- 4682 Housers Mill Rd
- 0 Barker Rd Unit 243030
- 0 Barker Rd Unit 14258525
- 0 Barker Rd Unit 175053
- 450 Jones Rd
- 0 Peavy Rd
- 39 English Ct
- 0 Moracci Way Unit 24354552
- 206 Christopher Dr
- 211 Fieldcrest Dr
- 88 Fieldcrest Dr
- 140 Fieldcrest Dr
- 212 Fieldcrest Dr
- 1310 John E Sullivan Rd
- 36 Fieldcrest Dr
- 266 Fieldcrest Dr
- 169 Fieldcrest Dr
- 1410 John E Sullivan Rd
- 89 Fieldcrest Dr
- 1204 John E Sullivan Rd
- 302 Fieldcrest Dr
- 263 Fieldcrest Dr
- 1442 John E Sullivan Rd
- 1202 John E Sullivan Rd
- 1440 John E Sullivan Rd
- 3763 Housers Mill Rd
- 4 and 5 Hwy 247 Connector
- 0 Highway 247 Conn Unit 10364666
- 0 Highway 247 Conn Unit 10053310
Your Personal Tour Guide
Ask me questions while you tour the home.