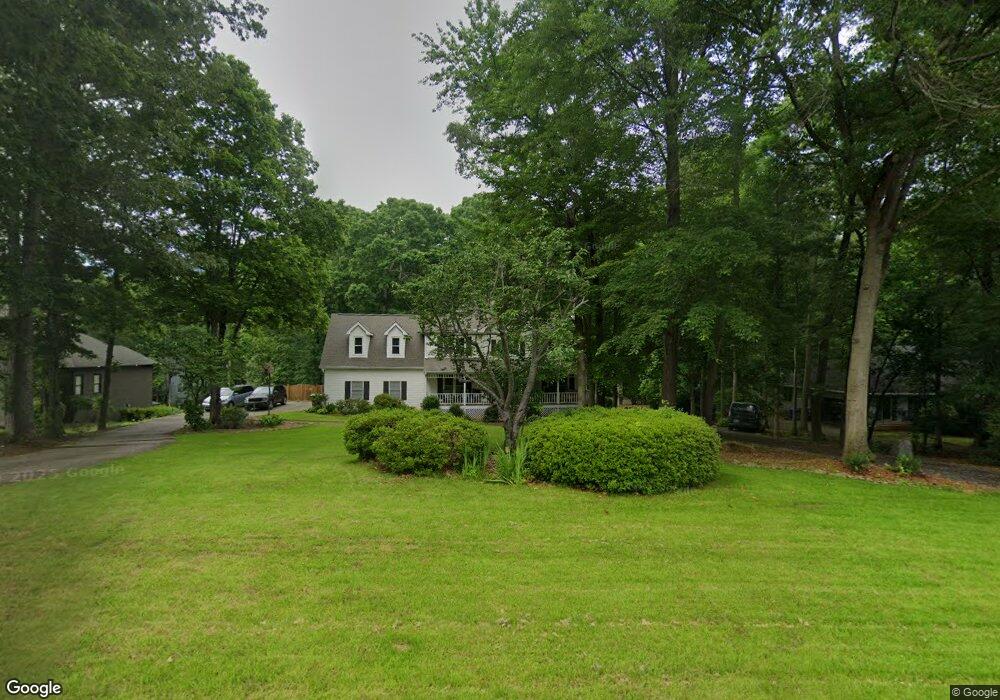
140 Indian Bluff Dr Sharpsburg, GA 30277
Estimated Value: $490,000 - $633,000
5
Beds
4
Baths
3,616
Sq Ft
$156/Sq Ft
Est. Value
About This Home
This home is located at 140 Indian Bluff Dr, Sharpsburg, GA 30277 and is currently estimated at $562,628, approximately $155 per square foot. 140 Indian Bluff Dr is a home located in Coweta County with nearby schools including Thomas Crossroads Elementary School, Lee Middle School, and Northgate High School.
Ownership History
Date
Name
Owned For
Owner Type
Purchase Details
Closed on
Oct 7, 2020
Sold by
Barrere Jonathan C
Bought by
Barrere Dina
Current Estimated Value
Home Financials for this Owner
Home Financials are based on the most recent Mortgage that was taken out on this home.
Original Mortgage
$277,000
Outstanding Balance
$245,363
Interest Rate
2.8%
Mortgage Type
New Conventional
Estimated Equity
$317,265
Purchase Details
Closed on
May 9, 2016
Sold by
Barrere Jonathan C
Bought by
Barrere Jonathan C and Barrere Dina N
Home Financials for this Owner
Home Financials are based on the most recent Mortgage that was taken out on this home.
Original Mortgage
$303,300
Interest Rate
3.59%
Mortgage Type
New Conventional
Purchase Details
Closed on
May 13, 1991
Bought by
Evans Jeffrey W and Evans Ji
Purchase Details
Closed on
Dec 21, 1990
Bought by
Carpenter Thomas All
Purchase Details
Closed on
Nov 19, 1990
Bought by
Freeman Steve
Create a Home Valuation Report for This Property
The Home Valuation Report is an in-depth analysis detailing your home's value as well as a comparison with similar homes in the area
Home Values in the Area
Average Home Value in this Area
Purchase History
| Date | Buyer | Sale Price | Title Company |
|---|---|---|---|
| Barrere Dina | -- | -- | |
| Barrere Jonathan C | -- | -- | |
| Barrere Jonathan C | $337,000 | -- | |
| Evans Jeffrey W | $117,100 | -- | |
| Carpenter Thomas All | -- | -- | |
| Carpenter Thomas All | $12,500 | -- | |
| Freeman Steve | $62,500 | -- |
Source: Public Records
Mortgage History
| Date | Status | Borrower | Loan Amount |
|---|---|---|---|
| Open | Barrere Dina | $277,000 | |
| Previous Owner | Barrere Jonathan C | $303,300 |
Source: Public Records
Tax History Compared to Growth
Tax History
| Year | Tax Paid | Tax Assessment Tax Assessment Total Assessment is a certain percentage of the fair market value that is determined by local assessors to be the total taxable value of land and additions on the property. | Land | Improvement |
|---|---|---|---|---|
| 2025 | $4,404 | $194,081 | $34,000 | $160,081 |
| 2024 | $4,222 | $186,449 | $34,000 | $152,449 |
| 2023 | $4,222 | $196,688 | $20,000 | $176,688 |
| 2022 | $3,932 | $164,326 | $20,000 | $144,326 |
| 2021 | $3,604 | $141,591 | $20,000 | $121,591 |
| 2020 | $3,214 | $148,249 | $20,000 | $128,249 |
| 2019 | $3,376 | $120,136 | $12,000 | $108,136 |
| 2018 | $3,382 | $120,136 | $12,000 | $108,136 |
| 2017 | $3,381 | $120,136 | $12,000 | $108,136 |
| 2016 | $2,605 | $94,664 | $12,000 | $82,664 |
| 2015 | $2,564 | $94,664 | $12,000 | $82,664 |
| 2014 | $2,312 | $86,371 | $12,000 | $74,371 |
Source: Public Records
Map
Nearby Homes
- 75 Tomahawk Dr
- 10 Queens Ct
- 10 Fisher Way
- 115 Platinum Ridge
- 95 Tyler Woods Dr
- 2039 Fischer Rd
- 2043 Fischer Rd
- 0 Maple Trail
- 68 Timbercreek Estates Dr
- 75 Kripple Kreek Dr
- 12 Race Point Way
- 125 Cannongate Cir
- 395 Beaumont Farms Dr
- 131 Cannongate Cir
- 136 Barrington Grange Dr
- 374 Beaumont Farms Dr
- 121 Northwoods Rd
- 200 Barrington Grange Dr
- 50 Barrington Grange Ct
- 319 Le Paradis Blvd
- 150 Indian Bluff Dr
- 15 Navaho Ln
- 160 Indian Bluff Dr
- 25 Navaho Ln
- 125 Indian Bluff Dr
- 145 Indian Bluff Dr
- 155 Indian Bluff Dr
- 120 Indian Bluff Dr
- 170 Indian Bluff Dr
- 37 Blackfoot Trail
- 45 Blackfoot Trail
- 35 Navaho Ln
- 57 Blackfoot Trail
- 105 Indian Bluff Dr
- 110 Indian Bluff Dr
- 180 Indian Bluff Dr
- 0 Blackfoot Trail Unit 8853805
- 0 Blackfoot Trail Unit 8021141
- 69 Blackfoot Trail
- 20 Cherokee Ct