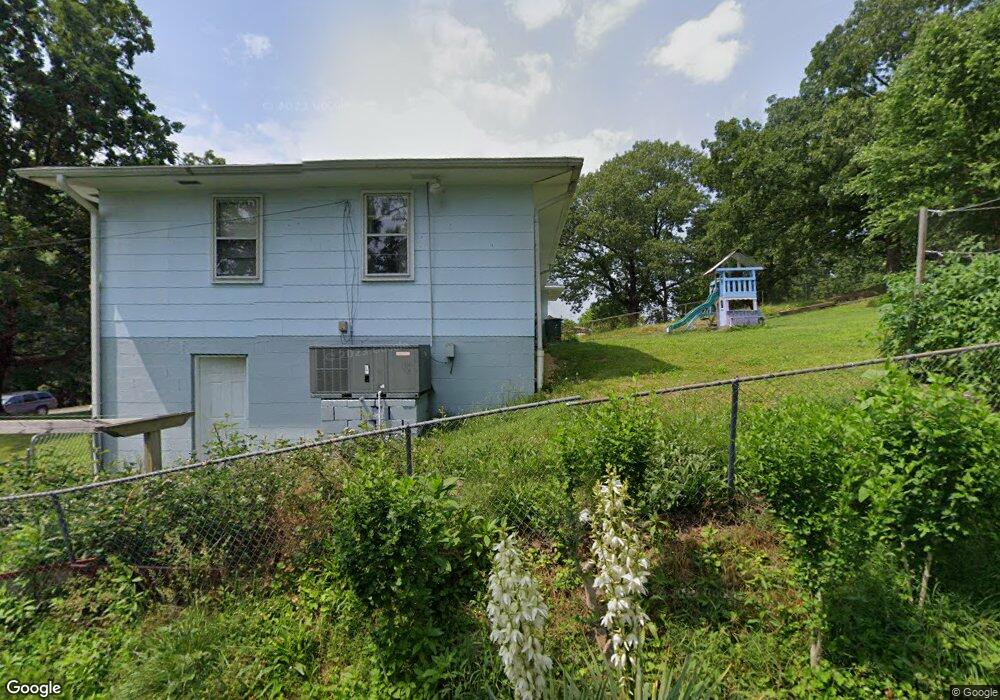
140 Jenkins Rd Rossville, GA 30741
Estimated Value: $213,128 - $237,000
--
Bed
2
Baths
1,629
Sq Ft
$137/Sq Ft
Est. Value
About This Home
This home is located at 140 Jenkins Rd, Rossville, GA 30741 and is currently estimated at $223,032, approximately $136 per square foot. 140 Jenkins Rd is a home located in Walker County with nearby schools including Stone Creek Elementary School, Rossville Middle School, and Ridgeland High School.
Ownership History
Date
Name
Owned For
Owner Type
Purchase Details
Closed on
Feb 21, 2006
Sold by
Not Provided
Bought by
Harrill Mitchell C and Harrill Elena
Current Estimated Value
Purchase Details
Closed on
Oct 7, 1998
Sold by
Harrill Mitchell C and Harrill Reeta S
Bought by
Harrill Mitchell C
Purchase Details
Closed on
Mar 15, 1996
Sold by
Kittle Roger D and Kittle Carol
Bought by
Harrill Mitchell C and Harrill Reeta S
Purchase Details
Closed on
Jul 6, 1982
Sold by
Meadows L D
Bought by
Kittle Roger D and Kittle Carol
Purchase Details
Closed on
Feb 6, 1981
Sold by
Mcdowell Mcdowell L and Mcdowell
Bought by
Meadows L D
Purchase Details
Closed on
Mar 31, 1978
Sold by
Dean Janet Pearl
Bought by
Mcdowell Mcdowell L and Mcdowell
Purchase Details
Closed on
Jul 29, 1977
Sold by
Carnes Roger D and Carnes Connie
Bought by
Dean Janet Pearl
Purchase Details
Closed on
Mar 2, 1977
Bought by
Carnes Roger D and Carnes Connie
Create a Home Valuation Report for This Property
The Home Valuation Report is an in-depth analysis detailing your home's value as well as a comparison with similar homes in the area
Home Values in the Area
Average Home Value in this Area
Purchase History
| Date | Buyer | Sale Price | Title Company |
|---|---|---|---|
| Harrill Mitchell C | -- | -- | |
| Harrill Mitchell C | -- | -- | |
| Harrill Mitchell C | $60,000 | -- | |
| Kittle Roger D | $5,000 | -- | |
| Meadows L D | -- | -- | |
| Mcdowell Mcdowell L | -- | -- | |
| Dean Janet Pearl | -- | -- | |
| Carnes Roger D | -- | -- |
Source: Public Records
Tax History Compared to Growth
Tax History
| Year | Tax Paid | Tax Assessment Tax Assessment Total Assessment is a certain percentage of the fair market value that is determined by local assessors to be the total taxable value of land and additions on the property. | Land | Improvement |
|---|---|---|---|---|
| 2024 | $1,393 | $59,344 | $3,194 | $56,150 |
| 2023 | $1,355 | $56,413 | $3,194 | $53,219 |
| 2022 | $1,253 | $48,916 | $3,194 | $45,722 |
| 2021 | $1,126 | $39,460 | $3,194 | $36,266 |
| 2020 | $980 | $32,596 | $3,194 | $29,402 |
| 2019 | $993 | $32,536 | $3,194 | $29,342 |
| 2018 | $861 | $32,536 | $3,194 | $29,342 |
| 2017 | $846 | $32,536 | $3,194 | $29,342 |
| 2016 | $758 | $32,536 | $3,194 | $29,342 |
| 2015 | $876 | $30,636 | $3,600 | $27,036 |
| 2014 | $787 | $30,636 | $3,600 | $27,036 |
| 2013 | $861 | $30,636 | $3,600 | $27,036 |
Source: Public Records
Map
Nearby Homes
- 112 Hunt St
- 9 Longstreet Rd
- 353 N Jenkins Rd
- 51 Circle Dr
- 57 Circle Dr
- 3 Reece St
- 7 Broadway St
- 83 Brandon Ln
- 7 Catherine St
- 823 Schmitt Rd
- 408 N Jenkins Rd
- 13 Travis Rd
- 145 Mission Ridge Rd
- 0 Sunset Cir Unit 1520989
- 0 Sunset Cir Unit 1517664
- 3 Fisher Rd
- 705 Park City Rd
- 0 Orchard Ave
- 0 Gate St
- 130 Sycamore Dr
- 200 Jenkins Rd
- 138 Jenkins Rd
- 202 Jenkins Rd
- 136 Jenkins Rd
- 204 Jenkins Rd
- 143 Jenkins Rd
- 152 Jenkins Rd
- 206 Jenkins Rd
- 134 Jenkins Rd
- 154 Jenkins Rd
- 154 Jenkins Rd
- 201 Jenkins Rd
- 135 Jenkins Rd
- 208 Jenkins Rd
- 208 N Jenkins Rd
- 4 Ivy St
- 34 Longstreet Rd Unit 1
- 36 Longstreet Rd
- 130 Jenkins Rd
- 133 Jenkins Rd