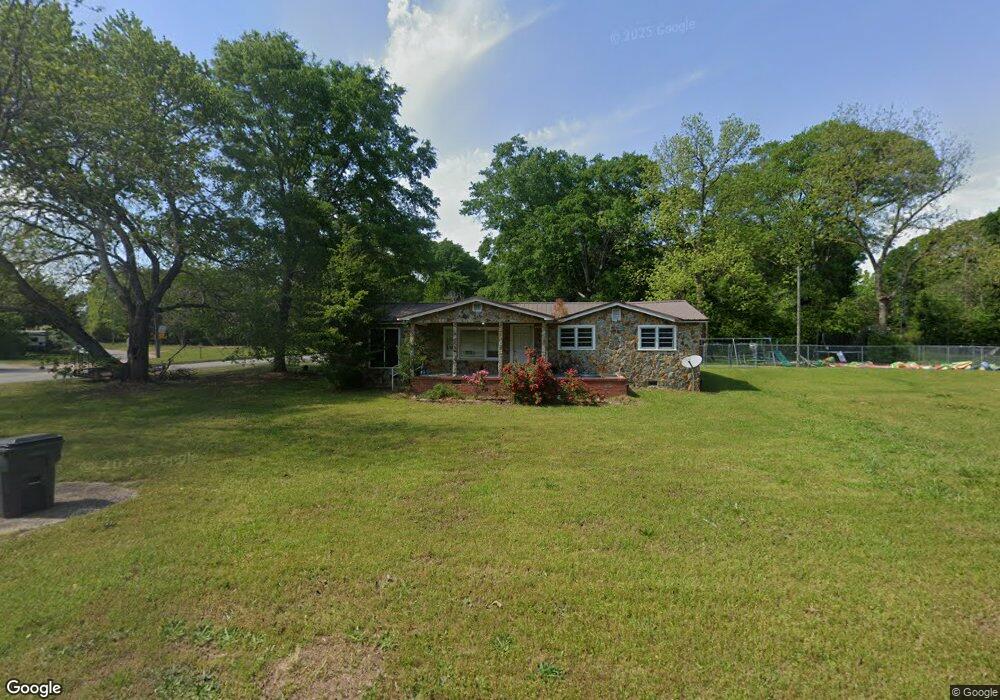
140 Jones Rd Unit 1A Griffin, GA 30223
Spalding County NeighborhoodEstimated Value: $110,000 - $170,114
2
Beds
1
Bath
1,488
Sq Ft
$97/Sq Ft
Est. Value
About This Home
This home is located at 140 Jones Rd Unit 1A, Griffin, GA 30223 and is currently estimated at $144,029, approximately $96 per square foot. 140 Jones Rd Unit 1A is a home located in Spalding County with nearby schools including Cowan Road Elementary School, Cowan Road Middle School, and Griffin High School.
Ownership History
Date
Name
Owned For
Owner Type
Purchase Details
Closed on
Apr 7, 2014
Sold by
Yeoman Joseph
Bought by
Barnhouse Mark A
Current Estimated Value
Home Financials for this Owner
Home Financials are based on the most recent Mortgage that was taken out on this home.
Original Mortgage
$39,750
Outstanding Balance
$30,206
Interest Rate
4.33%
Mortgage Type
New Conventional
Estimated Equity
$113,823
Purchase Details
Closed on
Jun 7, 2013
Sold by
Vining Bobby F
Bought by
Yeoman Joseph
Purchase Details
Closed on
Mar 2, 2011
Sold by
Vining Bobby F
Bought by
Vining Bobby F and Vining David E
Purchase Details
Closed on
Feb 27, 1975
Sold by
Local Mortgage Corp
Bought by
Vining Bobby Frank
Purchase Details
Closed on
Nov 27, 1968
Sold by
Modern Home Construction
Bought by
Gac Trans-World Accept Corp
Purchase Details
Closed on
Apr 3, 1962
Sold by
Vining Bobby F
Bought by
Modern Home Construction
Create a Home Valuation Report for This Property
The Home Valuation Report is an in-depth analysis detailing your home's value as well as a comparison with similar homes in the area
Home Values in the Area
Average Home Value in this Area
Purchase History
| Date | Buyer | Sale Price | Title Company |
|---|---|---|---|
| Barnhouse Mark A | $53,000 | -- | |
| Yeoman Joseph | $40,000 | -- | |
| Vining Bobby F | -- | -- | |
| Vining Bobby Frank | -- | -- | |
| Local Mortgage Corp | -- | -- | |
| Gac Trans-World Accept Corp | -- | -- | |
| Modern Home Construction | -- | -- |
Source: Public Records
Mortgage History
| Date | Status | Borrower | Loan Amount |
|---|---|---|---|
| Open | Barnhouse Mark A | $39,750 |
Source: Public Records
Tax History Compared to Growth
Tax History
| Year | Tax Paid | Tax Assessment Tax Assessment Total Assessment is a certain percentage of the fair market value that is determined by local assessors to be the total taxable value of land and additions on the property. | Land | Improvement |
|---|---|---|---|---|
| 2024 | $1,525 | $44,447 | $6,500 | $37,947 |
| 2023 | $1,525 | $44,447 | $6,500 | $37,947 |
| 2022 | $1,213 | $35,154 | $6,500 | $28,654 |
| 2021 | $833 | $24,712 | $3,968 | $20,744 |
| 2020 | $836 | $24,712 | $3,968 | $20,744 |
| 2019 | $853 | $24,712 | $3,968 | $20,744 |
| 2018 | $889 | $23,263 | $3,968 | $19,295 |
| 2017 | $865 | $23,263 | $3,968 | $19,295 |
| 2016 | $880 | $23,263 | $3,968 | $19,295 |
| 2015 | $826 | $23,263 | $3,968 | $19,295 |
| 2014 | $68 | $23,263 | $3,968 | $19,295 |
Source: Public Records
Map
Nearby Homes
- 78 Helen Dr
- 813 Vineyard Rd
- 111 Patterson Rd
- 313 Sammy Cir
- 110 Janie Ln
- 1022 Serene Lake Dr
- 611A Seminole Dr
- 208 Tyler Trace
- 130 N Morgan Dr
- 204 Vineyard Ridge Dr
- 441 Hickory Ln
- 1156 Burgundy Dr
- 114 King Richard Dr
- 1115 Burgundy Dr
- 111 Vineyard Rd
- 230 Manley Rd
- 205 Westmoreland Dr
- 4920 Fayetteville Rd
- 4940 Fayetteville Rd
- 4946 Fayetteville Rd