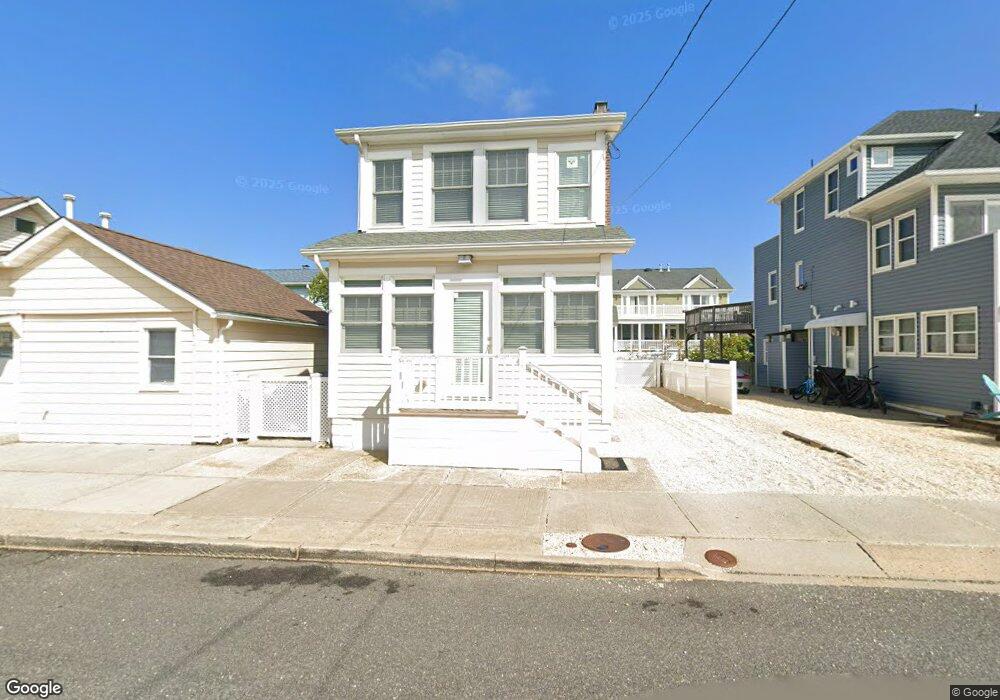
140 M St Seaside Park, NJ 08752
Estimated Value: $724,346 - $855,000
3
Beds
2
Baths
1,088
Sq Ft
$742/Sq Ft
Est. Value
About This Home
This home is located at 140 M St, Seaside Park, NJ 08752 and is currently estimated at $806,837, approximately $741 per square foot. 140 M St is a home located in Ocean County with nearby schools including Central Regional Middle School and Central Regional High School.
Ownership History
Date
Name
Owned For
Owner Type
Purchase Details
Closed on
Oct 28, 2011
Sold by
Irish Banter Llc
Bought by
Loftus Walter M and Loftus Carol A
Current Estimated Value
Home Financials for this Owner
Home Financials are based on the most recent Mortgage that was taken out on this home.
Original Mortgage
$308,000
Outstanding Balance
$122,289
Interest Rate
4.01%
Mortgage Type
New Conventional
Estimated Equity
$684,548
Purchase Details
Closed on
Jan 24, 2005
Sold by
Loftus Walter and Loftus Carol
Bought by
Irish Banter Llc
Home Financials for this Owner
Home Financials are based on the most recent Mortgage that was taken out on this home.
Original Mortgage
$333,700
Interest Rate
5.74%
Mortgage Type
New Conventional
Purchase Details
Closed on
Dec 8, 2004
Sold by
Madaras Lawrence H and Cullen Margaret
Bought by
Loftus Walter and Loftus Carol
Home Financials for this Owner
Home Financials are based on the most recent Mortgage that was taken out on this home.
Original Mortgage
$333,700
Interest Rate
5.74%
Mortgage Type
New Conventional
Create a Home Valuation Report for This Property
The Home Valuation Report is an in-depth analysis detailing your home's value as well as a comparison with similar homes in the area
Home Values in the Area
Average Home Value in this Area
Purchase History
| Date | Buyer | Sale Price | Title Company |
|---|---|---|---|
| Loftus Walter M | -- | None Available | |
| Irish Banter Llc | -- | -- | |
| Loftus Walter | $425,000 | -- |
Source: Public Records
Mortgage History
| Date | Status | Borrower | Loan Amount |
|---|---|---|---|
| Open | Loftus Walter M | $308,000 | |
| Previous Owner | Loftus Walter | $333,700 |
Source: Public Records
Tax History Compared to Growth
Tax History
| Year | Tax Paid | Tax Assessment Tax Assessment Total Assessment is a certain percentage of the fair market value that is determined by local assessors to be the total taxable value of land and additions on the property. | Land | Improvement |
|---|---|---|---|---|
| 2025 | $7,432 | $454,300 | $300,000 | $154,300 |
| 2024 | $7,310 | $454,300 | $300,000 | $154,300 |
| 2023 | $7,051 | $454,300 | $300,000 | $154,300 |
| 2022 | $7,051 | $454,300 | $300,000 | $154,300 |
| 2021 | $6,901 | $454,300 | $300,000 | $154,300 |
| 2020 | $6,828 | $454,300 | $300,000 | $154,300 |
| 2019 | $6,528 | $439,000 | $300,000 | $139,000 |
| 2018 | $6,102 | $439,000 | $300,000 | $139,000 |
| 2017 | $6,194 | $439,000 | $300,000 | $139,000 |
| 2016 | $5,760 | $439,000 | $300,000 | $139,000 |
| 2015 | $6,010 | $439,000 | $300,000 | $139,000 |
| 2014 | $5,742 | $439,000 | $300,000 | $139,000 |
Source: Public Records
Map
Nearby Homes