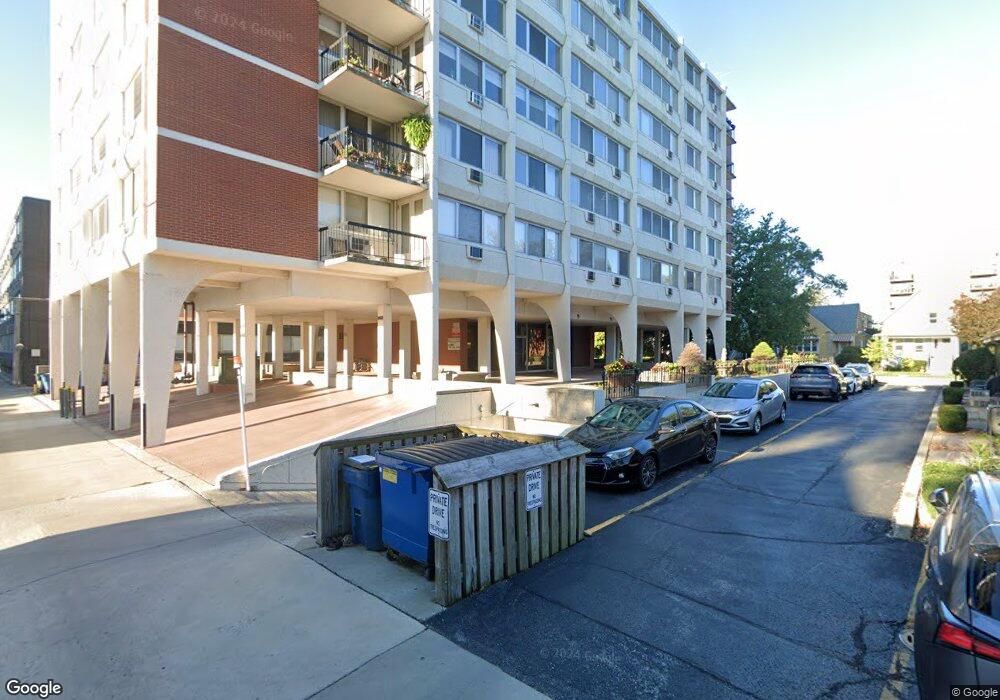
140 Marengo Ave Unit 502 Forest Park, IL 60130
Estimated Value: $218,366 - $253,000
3
Beds
2
Baths
1,600
Sq Ft
$147/Sq Ft
Est. Value
About This Home
This home is located at 140 Marengo Ave Unit 502, Forest Park, IL 60130 and is currently estimated at $235,342, approximately $147 per square foot. 140 Marengo Ave Unit 502 is a home located in Cook County with nearby schools including Garfield Elementary School, Field Stevenson Elementary School, and Forest Park Middle School.
Ownership History
Date
Name
Owned For
Owner Type
Purchase Details
Closed on
May 18, 2016
Sold by
American Bank
Bought by
Trainor Michael J and Michael J Trainor Revocable Living Trust
Current Estimated Value
Home Financials for this Owner
Home Financials are based on the most recent Mortgage that was taken out on this home.
Original Mortgage
$102,750
Outstanding Balance
$81,555
Interest Rate
3.57%
Mortgage Type
New Conventional
Estimated Equity
$153,787
Purchase Details
Closed on
May 29, 2008
Sold by
Trainor Marilyn A
Bought by
Midwest Bank & Trust Co and Trust #00-1-7676
Purchase Details
Closed on
Feb 29, 2008
Sold by
Trainor Marilyn A
Bought by
Midwest Bank & Trust Co
Purchase Details
Closed on
Jul 29, 1999
Sold by
Lavery Jeanne
Bought by
Trainor Kenneth E and Trainor Marilyn A
Create a Home Valuation Report for This Property
The Home Valuation Report is an in-depth analysis detailing your home's value as well as a comparison with similar homes in the area
Home Values in the Area
Average Home Value in this Area
Purchase History
| Date | Buyer | Sale Price | Title Company |
|---|---|---|---|
| Trainor Michael J | $137,000 | Chicago Title | |
| Midwest Bank & Trust Co | -- | None Available | |
| Midwest Bank & Trust Co | -- | None Available | |
| Trainor Kenneth E | $119,000 | -- |
Source: Public Records
Mortgage History
| Date | Status | Borrower | Loan Amount |
|---|---|---|---|
| Open | Trainor Michael J | $102,750 |
Source: Public Records
Tax History Compared to Growth
Tax History
| Year | Tax Paid | Tax Assessment Tax Assessment Total Assessment is a certain percentage of the fair market value that is determined by local assessors to be the total taxable value of land and additions on the property. | Land | Improvement |
|---|---|---|---|---|
| 2024 | $5,063 | $20,172 | $425 | $19,747 |
| 2023 | $3,799 | $20,172 | $425 | $19,747 |
| 2022 | $3,799 | $14,021 | $478 | $13,543 |
| 2021 | $3,639 | $14,020 | $478 | $13,542 |
| 2020 | $3,622 | $14,020 | $478 | $13,542 |
| 2019 | $3,925 | $14,577 | $435 | $14,142 |
| 2018 | $3,842 | $14,577 | $435 | $14,142 |
| 2017 | $3,778 | $14,577 | $435 | $14,142 |
| 2016 | $3,709 | $14,630 | $393 | $14,237 |
| 2015 | $3,095 | $14,630 | $393 | $14,237 |
| 2014 | $2,904 | $14,630 | $393 | $14,237 |
| 2013 | $2,845 | $15,228 | $393 | $14,835 |
Source: Public Records
Map
Nearby Homes
- 7251 Randolph St Unit C6
- 7240 Franklin St Unit 2A
- 7241 Franklin St Unit B
- 7415 Dixon St
- 246 S Maple Ave Unit 3W
- 300 Circle Ave Unit 4C
- 7421 Washington St
- 315 Marengo Ave Unit 2H
- 344 S Maple Ave Unit 3B
- 317 Wisconsin Ave Unit 1A
- 327 Wisconsin Ave Unit 5B
- 414 Clinton Place Unit 302
- 7449 Washington St Unit 207
- 7243 Madison St Unit 409
- 1042 Washington Blvd Unit 3W
- 435 William St Unit 205
- 435 William St Unit 607
- 426 Wisconsin Ave Unit 3S
- 424 Wisconsin Ave Unit 3N
- 339 Home Ave Unit 3B
- 140 Marengo Ave Unit 104
- 140 Marengo Ave Unit 604
- 140 Marengo Ave Unit 602
- 140 Marengo Ave Unit 406
- 140 Marengo Ave Unit 401
- 140 Marengo Ave Unit 301
- 140 Marengo Ave Unit 205
- 140 Marengo Ave Unit 102
- 140 Marengo Ave Unit 501
- 140 Marengo Ave Unit 101
- 140 Marengo Ave Unit 504
- 140 Marengo Ave Unit 405
- 140 Marengo Ave Unit 303
- 140 Marengo Ave Unit 404
- 140 Marengo Ave Unit 304
- 140 Marengo Ave Unit 306
- 140 Marengo Ave Unit 106
- 140 Marengo Ave Unit 202
- 140 Marengo Ave Unit 105
- 140 Marengo Ave Unit 506