140 Martin Prejean Rd Carencro, LA 70520
Estimated Value: $255,000 - $387,000
--
Bed
--
Bath
3,200
Sq Ft
$103/Sq Ft
Est. Value
About This Home
This home is located at 140 Martin Prejean Rd, Carencro, LA 70520 and is currently estimated at $330,959, approximately $103 per square foot. 140 Martin Prejean Rd is a home with nearby schools including Carencro Heights Elementary School, Acadian Middle School, and Carencro High School.
Ownership History
Date
Name
Owned For
Owner Type
Purchase Details
Closed on
Nov 16, 2021
Sold by
Duhon Clint James and Duhon Abby Dayl
Bought by
Soileau Cody Reginald and Soileau April Lalonde
Current Estimated Value
Home Financials for this Owner
Home Financials are based on the most recent Mortgage that was taken out on this home.
Original Mortgage
$269,700
Outstanding Balance
$247,475
Interest Rate
3.09%
Mortgage Type
New Conventional
Estimated Equity
$83,484
Purchase Details
Closed on
Sep 19, 2018
Sold by
Denali Development Llc
Bought by
Duhon Clint James and Duhon Abby Dayle
Home Financials for this Owner
Home Financials are based on the most recent Mortgage that was taken out on this home.
Original Mortgage
$150,000
Interest Rate
4.5%
Mortgage Type
New Conventional
Purchase Details
Closed on
Jul 14, 2017
Sold by
Lastrapes Duffy Jr Tony L and Lastrapes Duffy Collette Martina
Bought by
Denali Development Llc
Create a Home Valuation Report for This Property
The Home Valuation Report is an in-depth analysis detailing your home's value as well as a comparison with similar homes in the area
Home Values in the Area
Average Home Value in this Area
Purchase History
| Date | Buyer | Sale Price | Title Company |
|---|---|---|---|
| Soileau Cody Reginald | $2,900,000 | None Available | |
| Duhon Clint James | $150,000 | None Available | |
| Denali Development Llc | -- | None Available |
Source: Public Records
Mortgage History
| Date | Status | Borrower | Loan Amount |
|---|---|---|---|
| Open | Soileau Cody Reginald | $269,700 | |
| Previous Owner | Duhon Clint James | $150,000 |
Source: Public Records
Tax History Compared to Growth
Tax History
| Year | Tax Paid | Tax Assessment Tax Assessment Total Assessment is a certain percentage of the fair market value that is determined by local assessors to be the total taxable value of land and additions on the property. | Land | Improvement |
|---|---|---|---|---|
| 2024 | $1,721 | $26,997 | $8,947 | $18,050 |
| 2023 | $1,721 | $24,147 | $8,947 | $15,200 |
| 2022 | $2,127 | $24,147 | $8,947 | $15,200 |
| 2021 | $1,454 | $16,447 | $8,947 | $7,500 |
| 2020 | $1,453 | $16,447 | $8,947 | $7,500 |
| 2019 | $751 | $16,447 | $8,947 | $7,500 |
| 2018 | $689 | $8,032 | $6,778 | $1,254 |
| 2017 | $688 | $8,032 | $6,778 | $1,254 |
| 2015 | $445 | $5,214 | $5,214 | $0 |
Source: Public Records
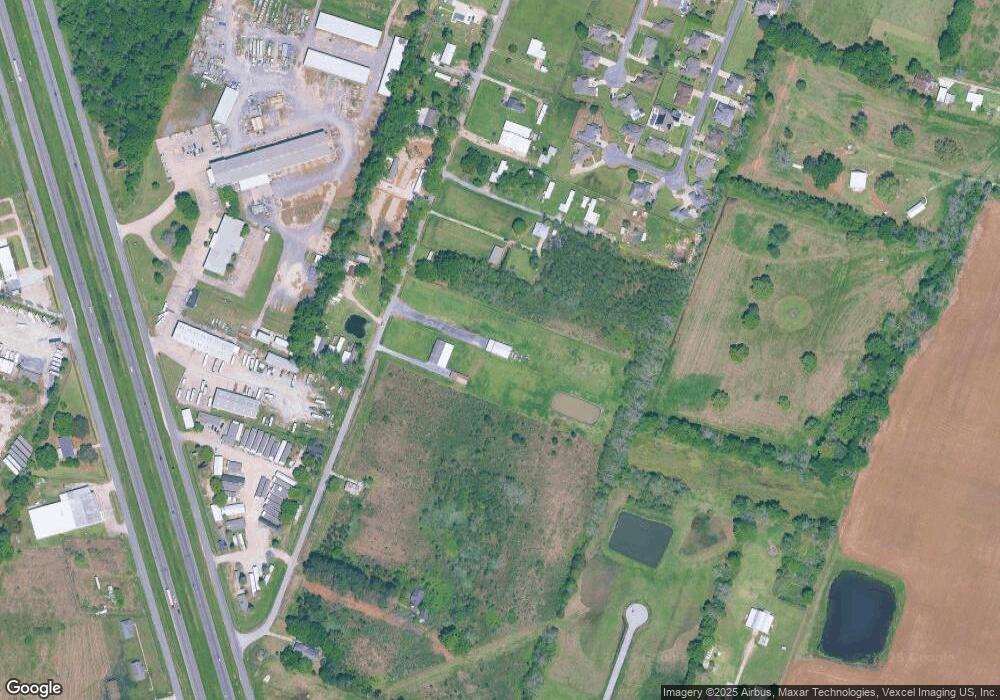
Map
Nearby Homes
- 111 Brice St
- 4246 NE Evangeline Thruway
- 106 Dunaway St
- 142 Brasseaux Rd
- 100 Sawtooth Rd
- 112 Buckleridge Rd
- 121 Legrande Rd
- 6305 N University Ave
- 1312 Post Rd
- 340 Saint Esprit Rd
- 000 Bennett Hills Dr
- 202 Saint Matthias Dr
- 307 Saint Matthias Dr
- 4911 NW Evangeline Thruway
- 331 Saint Matthias Dr
- 627 Rue Des Etoiles
- 441 Braquet Rd
- 427 Braquet Rd
- 193A Notre Reve Ln
- 576 Trappey Rd
- 211 Martin Prejean Rd
- 158 Martin Prejean Rd
- 203 Wadesboro Rd
- 203 Wadesboro Rd Rd
- 205 Wadesboro Rd
- 201 Wadesboro Rd
- 206 Martin Prejean Rd
- 115 Wadesboro Rd
- 204 Wadesboro Rd
- 202 Wadesboro Rd
- 112 Wadesboro Rd
- 112 Martin Prejean Rd
- 112 Martin Prejean Rd
- 103 Wadesboro Rd
- 117 Wadesboro Rd
- 105 Wadesboro Rd
- 110 Manchac Rd
- 111 Manchac Rd
- 113 Wadesboro Rd
- 110 Wadesboro Rd