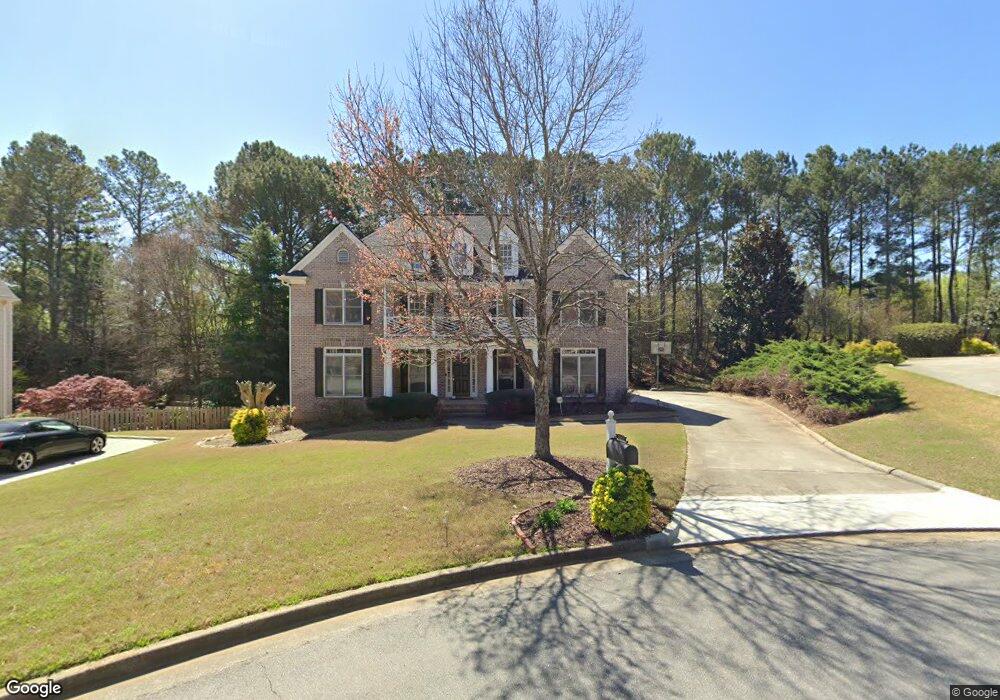
140 Millwick Cove Unit 8 Alpharetta, GA 30005
Seven Oaks NeighborhoodEstimated Value: $780,000 - $940,000
4
Beds
4
Baths
3,006
Sq Ft
$283/Sq Ft
Est. Value
About This Home
This home is located at 140 Millwick Cove Unit 8, Alpharetta, GA 30005 and is currently estimated at $852,078, approximately $283 per square foot. 140 Millwick Cove Unit 8 is a home located in Fulton County with nearby schools including Taylor Road Middle School, Chattahoochee High School, and Cresco Montessori School - Johns Creek Campus.
Ownership History
Date
Name
Owned For
Owner Type
Purchase Details
Closed on
Aug 10, 2006
Sold by
Ata Kamran
Bought by
Reddy Sreenivas and Reddy Jyothi
Current Estimated Value
Home Financials for this Owner
Home Financials are based on the most recent Mortgage that was taken out on this home.
Original Mortgage
$356,800
Outstanding Balance
$208,221
Interest Rate
6.25%
Mortgage Type
New Conventional
Estimated Equity
$643,857
Purchase Details
Closed on
Apr 30, 2002
Sold by
Hms John Wieland and Hms Neighborhoods
Bought by
Ata Kamran
Home Financials for this Owner
Home Financials are based on the most recent Mortgage that was taken out on this home.
Original Mortgage
$300,700
Interest Rate
6.5%
Mortgage Type
New Conventional
Create a Home Valuation Report for This Property
The Home Valuation Report is an in-depth analysis detailing your home's value as well as a comparison with similar homes in the area
Home Values in the Area
Average Home Value in this Area
Purchase History
| Date | Buyer | Sale Price | Title Company |
|---|---|---|---|
| Reddy Sreenivas | $446,000 | -- | |
| Ata Kamran | $385,500 | -- |
Source: Public Records
Mortgage History
| Date | Status | Borrower | Loan Amount |
|---|---|---|---|
| Open | Reddy Sreenivas | $356,800 | |
| Previous Owner | Ata Kamran | $300,700 |
Source: Public Records
Tax History Compared to Growth
Tax History
| Year | Tax Paid | Tax Assessment Tax Assessment Total Assessment is a certain percentage of the fair market value that is determined by local assessors to be the total taxable value of land and additions on the property. | Land | Improvement |
|---|---|---|---|---|
| 2025 | $5,637 | $292,800 | $82,600 | $210,200 |
| 2023 | $8,781 | $311,080 | $82,600 | $228,480 |
| 2022 | $5,386 | $226,160 | $52,360 | $173,800 |
| 2021 | $5,353 | $208,160 | $49,360 | $158,800 |
| 2020 | $5,405 | $208,160 | $49,360 | $158,800 |
| 2019 | $660 | $208,160 | $49,360 | $158,800 |
| 2018 | $5,496 | $229,080 | $48,200 | $180,880 |
| 2017 | $5,747 | $181,000 | $37,520 | $143,480 |
| 2016 | $5,655 | $181,000 | $37,520 | $143,480 |
| 2015 | $5,418 | $172,160 | $37,520 | $134,640 |
| 2014 | $5,612 | $172,160 | $37,520 | $134,640 |
Source: Public Records
Map
Nearby Homes
- 595 Barsham Way
- 11915 Carriage Park Ln
- 11800 Carriage Park Ln
- 230 Sessingham Ln
- 7260 Fawn Lake Dr
- 5785 Oxborough Way Unit 1
- 7335 Lytham Trace
- 11420 Crossington Rd
- 110 W Meadows Ct
- 11705 Bentham Ct Unit 1
- 7045 Harlech Trace
- 775 Ellsborough Ct
- 11575 Windbrooke Way Unit 2
- 5575 Ashwind Trace
- 11615 Windbrooke Way
- 640 Arncliffe Ct Unit 1
- 7170 Collingsworth Place
- 7105 Brookwood Way
- 130 Millwick Cove
- 150 Millwick Cove
- 120 Millwick Cove
- 160 St Amour Place
- 160 Saint Amour Place
- 170 Saint Amour Place
- 170 St Amour Place
- 145 Millwick Cove
- 0 Millwick Cove Unit 8033852
- 0 Millwick Cove Unit 8128845
- 125 Millwick Cove
- 135 Millwick Cove Unit 8
- 150 Saint Amour Place
- 150 St Amour Place
- 150 St Amour
- 180 Saint Amour Place
- 180 St Amour Place
- 110 Millwick Cove Unit 8B
- 115 Millwick Cove Unit 8
- 6055 Millwick Dr Unit 1C