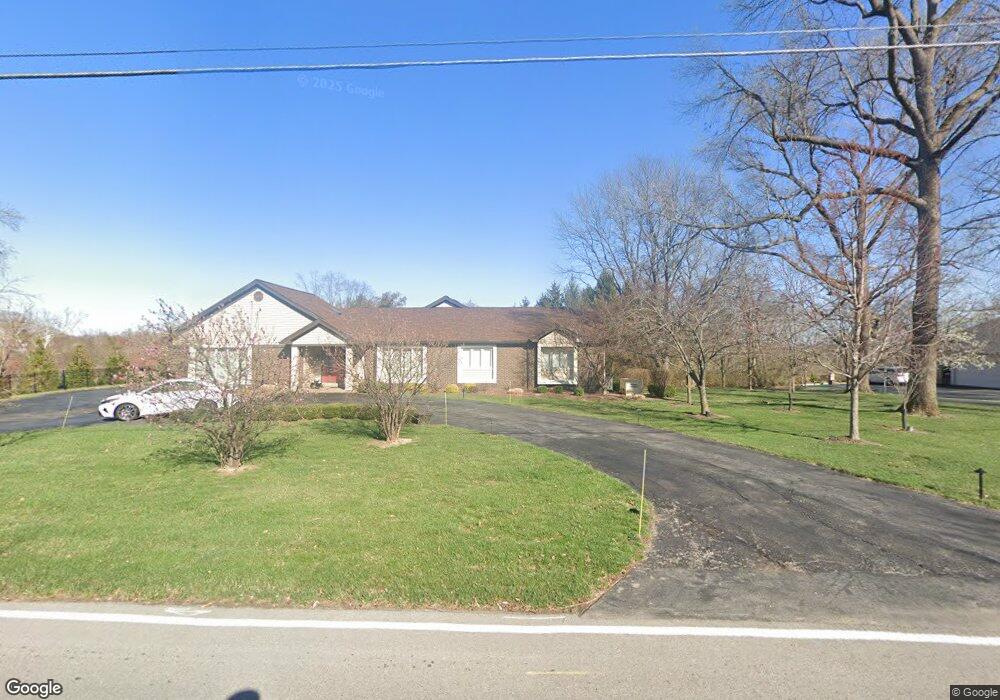
140 N Mosley Rd Saint Louis, MO 63141
Estimated Value: $1,148,804 - $1,784,000
5
Beds
6
Baths
3,414
Sq Ft
$396/Sq Ft
Est. Value
About This Home
This home is located at 140 N Mosley Rd, Saint Louis, MO 63141 and is currently estimated at $1,351,451, approximately $395 per square foot. 140 N Mosley Rd is a home located in St. Louis County with nearby schools including Ladue 5th Grade Center, Spoede Elementary School, and Ladue Middle.
Ownership History
Date
Name
Owned For
Owner Type
Purchase Details
Closed on
May 30, 2013
Sold by
Brown Amanda A
Bought by
Hillebrandt William F and Lamb Angela Belle
Current Estimated Value
Home Financials for this Owner
Home Financials are based on the most recent Mortgage that was taken out on this home.
Original Mortgage
$400,000
Outstanding Balance
$282,550
Interest Rate
3.41%
Mortgage Type
New Conventional
Estimated Equity
$1,068,901
Purchase Details
Closed on
Feb 18, 2013
Sold by
Brown Amanda A and Brown Paul J
Bought by
Brown Amanda A
Purchase Details
Closed on
May 29, 2003
Sold by
Spivack Alan R and Spivack Cecelia A
Bought by
Brown Paul J and Brown Amanda A
Home Financials for this Owner
Home Financials are based on the most recent Mortgage that was taken out on this home.
Original Mortgage
$745,000
Interest Rate
5.79%
Mortgage Type
Unknown
Create a Home Valuation Report for This Property
The Home Valuation Report is an in-depth analysis detailing your home's value as well as a comparison with similar homes in the area
Home Values in the Area
Average Home Value in this Area
Purchase History
| Date | Buyer | Sale Price | Title Company |
|---|---|---|---|
| Hillebrandt William F | $733,830 | Us Title Main | |
| Brown Amanda A | -- | Us Title Main | |
| Brown Paul J | $745,000 | -- |
Source: Public Records
Mortgage History
| Date | Status | Borrower | Loan Amount |
|---|---|---|---|
| Open | Hillebrandt William F | $400,000 | |
| Previous Owner | Brown Paul J | $745,000 |
Source: Public Records
Tax History Compared to Growth
Tax History
| Year | Tax Paid | Tax Assessment Tax Assessment Total Assessment is a certain percentage of the fair market value that is determined by local assessors to be the total taxable value of land and additions on the property. | Land | Improvement |
|---|---|---|---|---|
| 2025 | $12,912 | $185,250 | $85,800 | $99,450 |
| 2024 | $12,912 | $185,250 | $76,270 | $108,980 |
| 2023 | $12,896 | $185,250 | $76,270 | $108,980 |
| 2022 | $11,682 | $161,500 | $85,800 | $75,700 |
| 2021 | $11,593 | $175,400 | $85,800 | $89,600 |
| 2020 | $10,916 | $150,100 | $76,150 | $73,950 |
| 2019 | $10,728 | $150,100 | $76,150 | $73,950 |
| 2018 | $10,507 | $135,770 | $49,510 | $86,260 |
| 2017 | $10,491 | $135,770 | $49,510 | $86,260 |
| 2016 | $10,782 | $136,060 | $49,510 | $86,550 |
| 2015 | $10,286 | $136,060 | $49,510 | $86,550 |
| 2014 | $8,883 | $113,840 | $44,000 | $69,840 |
Source: Public Records
Map
Nearby Homes
- 11239 Mosley Hill Dr
- 111 N Mosley Rd
- 38 Ladue Meadows
- 216 Townsend St
- 241 S Graeser Rd
- 11563 Templar Dr
- 12 Morwood Ln
- 44 Villa Coublay
- 526 Sarah Ln Unit 27
- 556 N Graeser Rd
- 514 Coeur de Royale Dr Unit 202
- 578 Sarah Ln Unit 405
- 508 Coeur de Royale Dr Unit 301
- 561 Sarah Ln Unit 204
- 561 Sarah Ln Unit 107
- 561 Sarah Ln Unit 103
- 11906 Santino Ct
- 590 Sarah Ln Unit 303
- 539 Coeur de Royale Dr Unit 105
- 539 Coeur de Royale Dr Unit 108
- 11233 Ladue Rd
- 146 N Mosley Rd
- 11234 Mosley Hill Dr
- 132 N Mosley Rd
- 11242 Mosley Hill Dr
- 135 Mystic Meadows Ln
- 210 N Mosley Rd
- 120 N Mosley Rd
- 11226 Mosley Hill Dr
- 121 Mystic Meadows Ln
- 11231 Mosley Hill Dr
- 11247 Mosley Hill Dr
- 201 N Mosley Rd
- 11255 Ladue Rd
- 131 N Mosley Rd
- 209 N Mosley Rd
- 11218 Mosley Hill Dr
- 11223 Mosley Hill Dr
- 123 N Mosley Rd
- 108 N Mosley Rd