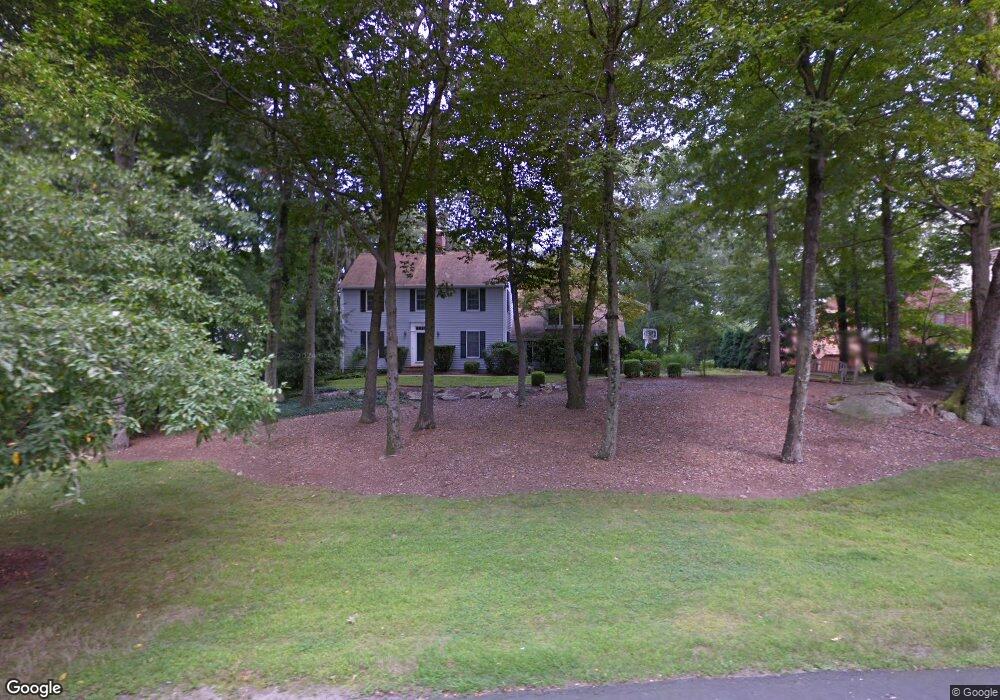
140 Old Stone Bridge Rd Cos Cob, CT 06807
Estimated Value: $2,309,815 - $2,625,000
4
Beds
4
Baths
3,384
Sq Ft
$723/Sq Ft
Est. Value
About This Home
This home is located at 140 Old Stone Bridge Rd, Cos Cob, CT 06807 and is currently estimated at $2,447,454, approximately $723 per square foot. 140 Old Stone Bridge Rd is a home located in Fairfield County with nearby schools including North Street School, Central Middle School, and Greenwich High School.
Ownership History
Date
Name
Owned For
Owner Type
Purchase Details
Closed on
Jan 6, 2021
Sold by
Harry Joel Carrel Ret
Bought by
Carrel Harry J and Dornbrowski Nadia A
Current Estimated Value
Home Financials for this Owner
Home Financials are based on the most recent Mortgage that was taken out on this home.
Original Mortgage
$747,000
Outstanding Balance
$666,700
Interest Rate
2.71%
Mortgage Type
Balloon
Estimated Equity
$1,780,754
Purchase Details
Closed on
Dec 20, 2017
Sold by
Carrel Harry and Dombrowski Nadia
Bought by
Carrel Harry
Purchase Details
Closed on
May 28, 1997
Sold by
Edgar Kenneth C and Ramsey-Edgar Jill
Bought by
Carrel Harry J and Dombrowski Nadia A
Home Financials for this Owner
Home Financials are based on the most recent Mortgage that was taken out on this home.
Original Mortgage
$550,000
Interest Rate
8.13%
Mortgage Type
Unknown
Create a Home Valuation Report for This Property
The Home Valuation Report is an in-depth analysis detailing your home's value as well as a comparison with similar homes in the area
Home Values in the Area
Average Home Value in this Area
Purchase History
| Date | Buyer | Sale Price | Title Company |
|---|---|---|---|
| Carrel Harry J | -- | None Available | |
| Nable A Dombrowski Ret | -- | None Available | |
| Carrel Harry | -- | -- | |
| Carrel Harry J | $790,000 | -- |
Source: Public Records
Mortgage History
| Date | Status | Borrower | Loan Amount |
|---|---|---|---|
| Open | Carrel Harry J | $747,000 | |
| Previous Owner | Carrel Harry J | $550,000 |
Source: Public Records
Tax History Compared to Growth
Tax History
| Year | Tax Paid | Tax Assessment Tax Assessment Total Assessment is a certain percentage of the fair market value that is determined by local assessors to be the total taxable value of land and additions on the property. | Land | Improvement |
|---|---|---|---|---|
| 2025 | $11,765 | $977,200 | $523,600 | $453,600 |
| 2024 | $11,443 | $977,200 | $523,600 | $453,600 |
| 2023 | $11,130 | $977,200 | $523,600 | $453,600 |
| 2022 | $11,023 | $977,200 | $523,600 | $453,600 |
| 2021 | $11,961 | $1,032,010 | $476,000 | $556,010 |
| 2020 | $11,961 | $1,032,010 | $476,000 | $556,010 |
| 2019 | $11,614 | $994,350 | $476,000 | $518,350 |
| 2018 | $11,306 | $994,350 | $476,000 | $518,350 |
| 2017 | $11,306 | $994,350 | $476,000 | $518,350 |
| 2016 | $11,137 | $994,350 | $476,000 | $518,350 |
| 2015 | $10,350 | $918,400 | $581,210 | $337,190 |
| 2014 | $10,075 | $918,400 | $581,210 | $337,190 |
Source: Public Records
Map
Nearby Homes
- 9 Walnut St
- 34 Dublin Hill Rd
- 75 W Glen Dr
- 10 Tomahawk Ln
- 92 Hillcrest Park Rd
- 6 Fox Hollow Ln
- 333 Palmer Hill Rd Unit 2E
- 116 Hillcrest Park Rd
- 60 Greenleaf Dr
- 24 Sawmill Ln
- 887 Westover Rd
- 43 Sawmill Ln
- 177 Long Close Rd
- 50 Dingletown Rd
- 7 Pleasant View Place
- 78 Londonderry Dr
- 11 Winterset Rd
- 10 Copper Beech Rd
- 28 N Ridge Rd
- 382 North St
- 140 N Old Stone Bridge Rd
- 146 Old Stone Bridge Rd
- 136 Old Stone Bridge Rd
- 120 N Old Stone Bridge Rd
- 150 Old Stone Bridge Rd
- 108 Old Stone Bridge Rd
- 104 N Old Stone Bridge Rd
- 150 N Old Stone Bridge Rd
- 120 Old Stone Bridge Rd
- 104 Old Stone Bridge Rd
- 92 N Old Stone Bridge Rd
- 112 Old Stone Bridge Rd
- 130 Old Stone Bridge Rd Unit R
- 130 Old Stone Bridge Rd
- 36 Old Stone Bridge Rd
- 92 Stonebridge Rd
- 92 Old Stone Bridge Rd
- 96 N Old Stone Bridge Rd
- 40 N Old Stone Bridge Rd
- 36 Old Stone Bridge Rd