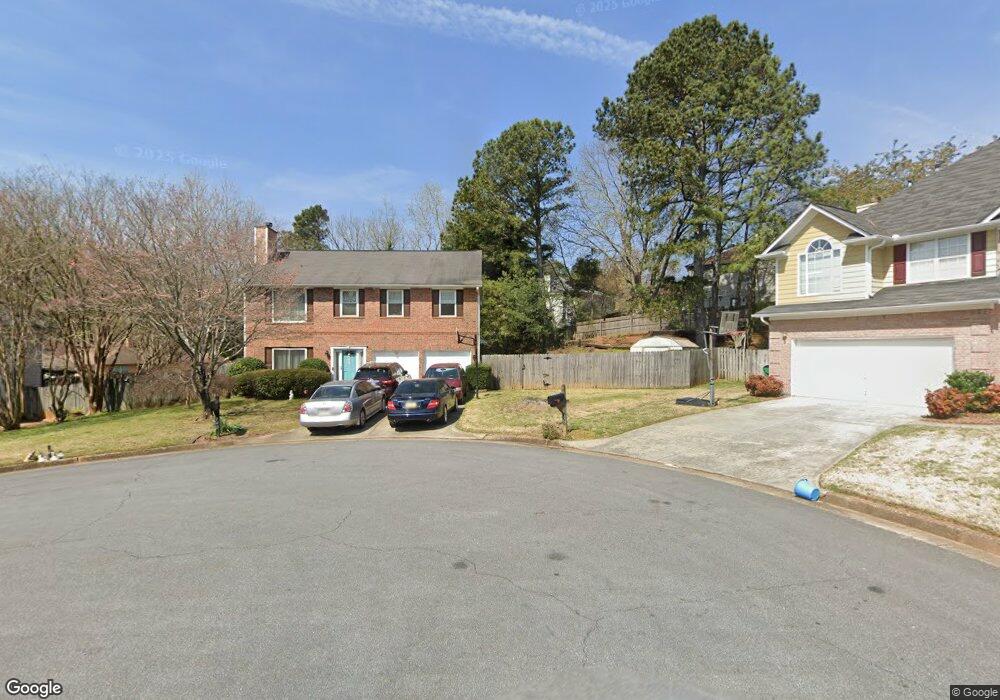
140 Overlake Ct Alpharetta, GA 30022
Estimated Value: $511,000 - $591,265
4
Beds
3
Baths
2,328
Sq Ft
$240/Sq Ft
Est. Value
About This Home
This home is located at 140 Overlake Ct, Alpharetta, GA 30022 and is currently estimated at $559,066, approximately $240 per square foot. 140 Overlake Ct is a home located in Fulton County with nearby schools including State Bridge Crossing Elementary School, Taylor Road Middle School, and Chattahoochee High School.
Ownership History
Date
Name
Owned For
Owner Type
Purchase Details
Closed on
May 23, 2008
Sold by
Johnson Christina C
Bought by
Po Emmanuel and Po Mary C
Current Estimated Value
Home Financials for this Owner
Home Financials are based on the most recent Mortgage that was taken out on this home.
Original Mortgage
$211,850
Outstanding Balance
$134,023
Interest Rate
5.86%
Mortgage Type
New Conventional
Estimated Equity
$425,043
Purchase Details
Closed on
Apr 23, 1998
Sold by
Srinivasan Sarathi
Bought by
Johnson Christina C
Home Financials for this Owner
Home Financials are based on the most recent Mortgage that was taken out on this home.
Original Mortgage
$90,000
Interest Rate
7.02%
Mortgage Type
New Conventional
Create a Home Valuation Report for This Property
The Home Valuation Report is an in-depth analysis detailing your home's value as well as a comparison with similar homes in the area
Home Values in the Area
Average Home Value in this Area
Purchase History
| Date | Buyer | Sale Price | Title Company |
|---|---|---|---|
| Po Emmanuel | $223,000 | -- | |
| Johnson Christina C | $140,000 | -- |
Source: Public Records
Mortgage History
| Date | Status | Borrower | Loan Amount |
|---|---|---|---|
| Open | Po Emmanuel | $211,850 | |
| Previous Owner | Johnson Christina C | $90,000 |
Source: Public Records
Tax History Compared to Growth
Tax History
| Year | Tax Paid | Tax Assessment Tax Assessment Total Assessment is a certain percentage of the fair market value that is determined by local assessors to be the total taxable value of land and additions on the property. | Land | Improvement |
|---|---|---|---|---|
| 2025 | $5,875 | $233,760 | $58,960 | $174,800 |
| 2023 | $5,875 | $183,840 | $47,800 | $136,040 |
| 2022 | $4,527 | $147,520 | $50,480 | $97,040 |
| 2021 | $4,067 | $129,080 | $41,720 | $87,360 |
| 2020 | $4,106 | $127,560 | $41,240 | $86,320 |
| 2019 | $494 | $125,280 | $40,480 | $84,800 |
| 2018 | $3,371 | $103,520 | $28,320 | $75,200 |
| 2017 | $2,931 | $86,120 | $19,480 | $66,640 |
| 2016 | $2,889 | $86,120 | $19,480 | $66,640 |
| 2015 | $2,834 | $83,560 | $19,480 | $64,080 |
| 2014 | $2,494 | $70,720 | $16,480 | $54,240 |
Source: Public Records
Map
Nearby Homes
- 5022 Anclote Dr
- 4965 Cinnabar Dr
- 10840 Mortons Crossing
- 5060 Cinnabar Dr
- 225 Morton Creek Cir
- 220 Magnolia Tree Ct
- 120 Donamere Ct
- 465 Mikasa Dr
- 425 Mikasa Dr
- 4965 N Bridges Dr
- 10906 Gallier St
- 230 Pinebridge Ct
- 165 Morton Walk Dr Unit 1
- 11125 Linbrook Ln
- 130 Douglas Fir Ct Unit 1
- 4740 Carversham Way
- 6365 Murets Rd
- 4790 Roswell Mill Dr
- 11041 Parsons Rd
- 11035 Parsons Rd
- 130 Overlake Ct
- 11035 Mortons Crossing
- 11045 Mortons Crossing
- 150 Overlake Ct
- 11025 Mortons Crossing
- 120 Overlake Ct
- 11055 Mortons Crossing Unit 11A
- 110 Overlake Ct Unit 2A
- 215 Overlake Ct
- 11015 Mortons Crossing
- 195 Overlake Ct
- 185 Overlake Ct
- 205 Overlake Ct
- 270 E Taylors Crossing
- 280 E Taylors Crossing
- 11130 Mortons Crossing
- 0 Overlake Ct Unit 7077088
- 0 Overlake Ct Unit 7610079
- 11120 Mortons Crossing
- 175 Overlake Ct