Estimated Value: $534,000 - $607,000
3
Beds
2
Baths
1,620
Sq Ft
$355/Sq Ft
Est. Value
About This Home
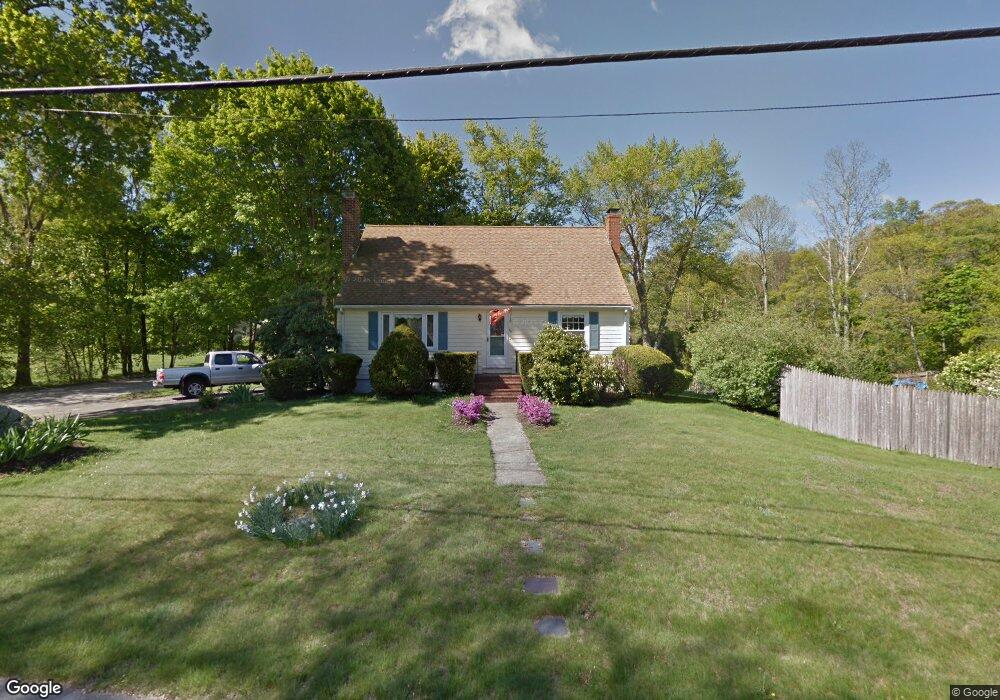
This home is located at 140 Page St, Avon, MA 02322 and is currently estimated at $575,402, approximately $355 per square foot. 140 Page St is a home located in Norfolk County with nearby schools including Ralph D. Butler Elementary School, Avon Middle/High School, and Lighthouse Baptist Christian Academy.
Ownership History
Date
Name
Owned For
Owner Type
Purchase Details
Closed on
Jun 24, 2025
Sold by
Rodriguez Bernardo and Rodriguez Barbara A
Bought by
Rodriguez Lt and Rodriguez
Current Estimated Value
Create a Home Valuation Report for This Property
The Home Valuation Report is an in-depth analysis detailing your home's value as well as a comparison with similar homes in the area
Home Values in the Area
Average Home Value in this Area
Purchase History
| Date | Buyer | Sale Price | Title Company |
|---|---|---|---|
| Rodriguez Lt | -- | -- | |
| Rodriguez Lt | -- | -- |
Source: Public Records
Tax History Compared to Growth
Tax History
| Year | Tax Paid | Tax Assessment Tax Assessment Total Assessment is a certain percentage of the fair market value that is determined by local assessors to be the total taxable value of land and additions on the property. | Land | Improvement |
|---|---|---|---|---|
| 2025 | $6,830 | $512,000 | $195,600 | $316,400 |
| 2024 | $6,545 | $466,500 | $185,400 | $281,100 |
| 2023 | $6,354 | $466,500 | $185,400 | $281,100 |
| 2022 | $6,321 | $399,800 | $154,700 | $245,100 |
| 2021 | $5,417 | $322,800 | $140,400 | $182,400 |
| 2020 | $5,404 | $305,300 | $137,600 | $167,700 |
| 2019 | $5,552 | $308,600 | $137,600 | $171,000 |
| 2018 | $5,673 | $305,800 | $137,600 | $168,200 |
| 2017 | $4,641 | $268,600 | $137,600 | $131,000 |
| 2016 | $4,743 | $277,200 | $137,500 | $139,700 |
| 2015 | $4,233 | $258,600 | $125,000 | $133,600 |
Source: Public Records
Map
Nearby Homes